Solana started a downside correction from $24 against the US Dollar. SOL price might start a fresh increase if it stays above the $21.50 support.
- SOL price is correcting lower from the $24 resistance against the US Dollar.
- The price is now trading below $23.50 and the 100 simple moving average (4 hours).
- There was a break above a major bearish trend line with resistance near $22.50 on the 4-hour chart of the SOL/USD pair (data source from Kraken).
- The pair could start a fresh increase if it stays above the $21.50 support.
Solana Price Remains Supported
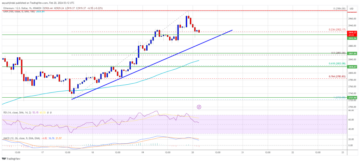
This past week, Solana’s price formed a base above the $20.50 level. SOL started a fresh increase and was able to clear the $21.50 resistance. There was a break above a major bearish trend line with resistance near $22.50 on the 4-hour chart of the SOL/USD pair.
However, the bears were active near the $24 resistance. A high is formed near $23.99 and the price is now correcting gains, similar to Bitcoin and Ethereum.
SOL declined below the $23.50 and $23.00 levels. There was a drop below the 50% Fib retracement level of the upward move from the $20.39 swing low to the $23.99 high. It is now trading below $23.50 and the 100 simple moving average (4 hours).
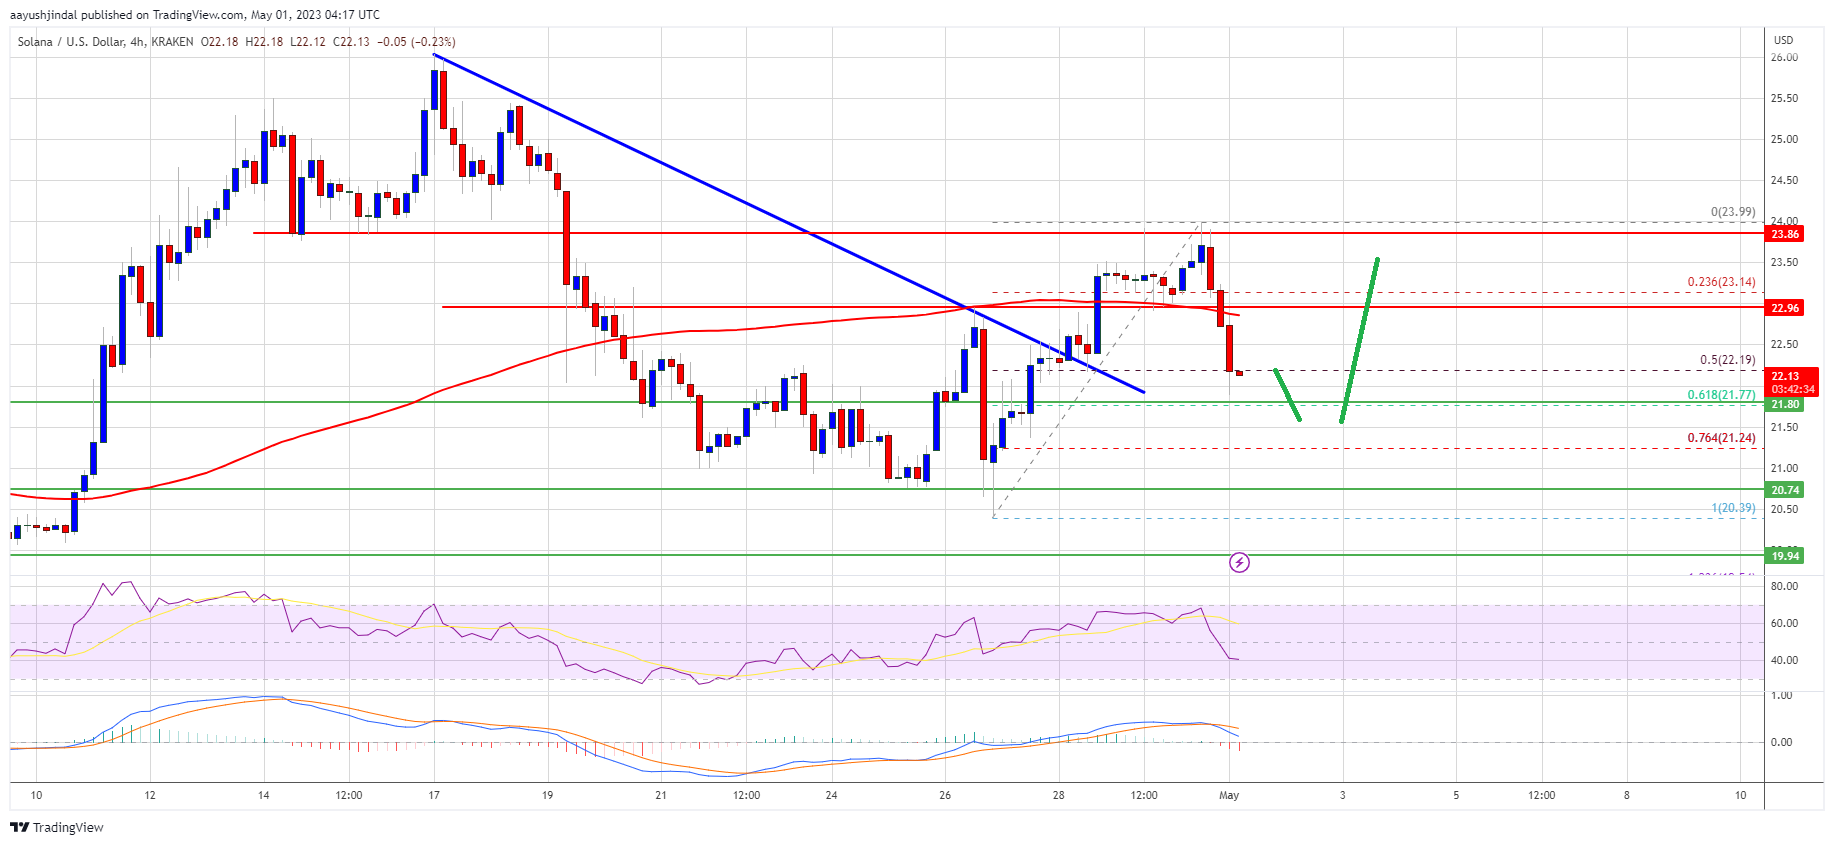
Source: SOLUSD on TradingView.com
On the upside, immediate resistance is near the $22.50 level. The next major resistance is near the $23 zone and the 100 simple moving average (4 hours). A close above the $23 level could resend the price toward the $24 resistance zone. Any more gains might send the price toward the $25 level.
More Losses in SOL?
If SOL fails to clear the $23 resistance, it could continue to move down. Initial support on the downside is near the $21.75 level or the 61.8% Fib retracement level of the upward move from the $20.39 swing low to the $23.99 high.
The first major support is near the $21.50 level, below which the bears might gain strength. In the stated case, the price may perhaps decline toward the $20.40 support. The next major support is near the $20 level.
Technical Indicators
4-Hours MACD – The MACD for SOL/USD is gaining pace in the bearish zone.
4-Hours RSI (Relative Strength Index) – The RSI for SOL/USD is below the 50 level.
Major Support Levels – $21.75, $21.50, and $20.00.
Major Resistance Levels – $22.50, $23, and $24.
- SEO Powered Content & PR Distribution. Get Amplified Today.
- PlatoAiStream. Web3 Data Intelligence. Knowledge Amplified. Access Here.
- Minting the Future w Adryenn Ashley. Access Here.
- Source: https://www.newsbtc.com/analysis/sol-price-prediction-solana-drops-22/
- :is
- $UP
- 100
- 39
- 50
- a
- Able
- above
- active
- against
- and
- any
- average
- base
- bearish
- Bears
- below
- Break
- Bulls
- but
- case
- Chart
- clear
- Close
- continue
- could
- data
- Decline
- Dollar
- down
- downside
- Drop
- Drops
- Early
- fails
- First
- For
- formed
- fresh
- fresh increase
- from
- Gain
- gaining
- Gains
- given
- Have
- High
- HOURS
- HTTPS
- if
- immediate
- in
- Increase
- index
- initial
- IT
- Kraken
- Level
- levels
- Line
- losses
- Low
- MACD
- major
- max-width
- May..
- might
- more
- move
- moving
- moving average
- Near
- NewsBTC
- next
- now
- of
- on
- or
- Pace
- past
- perhaps
- plato
- Plato Data Intelligence
- PlatoData
- prediction
- price
- Price Prediction
- relative strength index
- remains
- Resistance
- retracement
- rsi
- say
- send
- similar
- Simple
- SOL
- SOL Price
- SOL/USD
- Solana
- Source
- start
- started
- stated
- strength
- support
- support levels
- Swing
- The
- There.
- to
- too
- toward
- Trading
- TradingView
- Trend
- Upside
- upward
- us
- US Dollar
- was
- week
- were
- which
- with
- zephyrnet