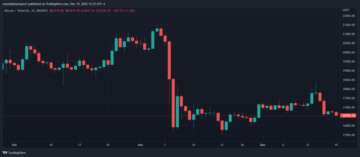
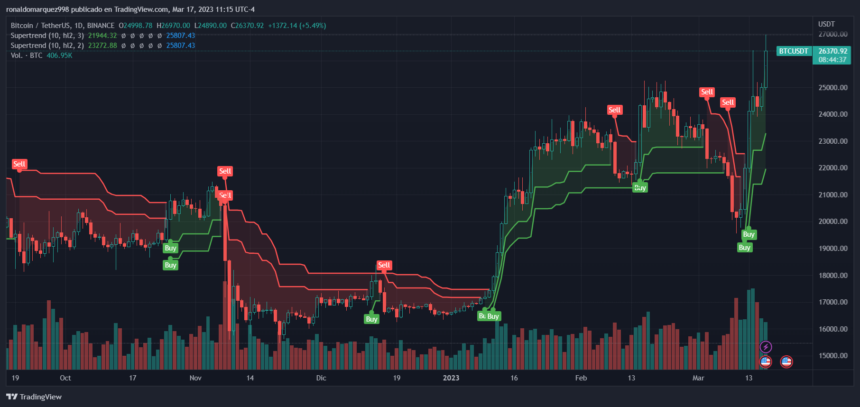
After experiencing a sharp decline to $19,700 last week, Bitcoin (BTC) found support at its 200-day moving average (MA). This support helped the largest cryptocurrency by market capitalization to rebound and surpass the previous resistance level of $25,200.
After a month of fluctuations, Bitcoin is currently on an upward trend, trading at $26,300. The 200-day moving average (MA) provides a strong support level, suggesting that BTC may be primed to reach new annual highs and approach the $30,000 level. However, this rally may be coupled with high volatility.
Early Stages of A Bull Market
“JJ the Janitor,” an analyst on the Jarvis Lab team, considers the $19,700 level where Bitcoin hit bottom last week, as represented by the 200-day MA, to be a critical indicator for determining the current trend of BTC. He noted:
The fact that it was tested and held might confirm the thesis we’ve been sharing all year: This is the early stage of a new bull market rally, not the late stages of a bear market rally.
The analyst believes that in the initial phases of a bull market, prices will eventually reach a point where they become overvalued, triggering a chain reaction of liquidations of the “long open interest.” This liquidation cascade could occur as BTC approaches the $30,000 level.
In a future liquidation cascade, prices could plummet towards significant support levels, such as the 200-day MA, which will continue to rise as the BTC price increases.
Bitcoin Natural State Of High Volatility
While the price of Bitcoin is currently above the 200-week MA, for the analyst, this represents a short-term victory, as if it holds this line, there will be no “overhead” resistance for BTC for the first time since 2021.
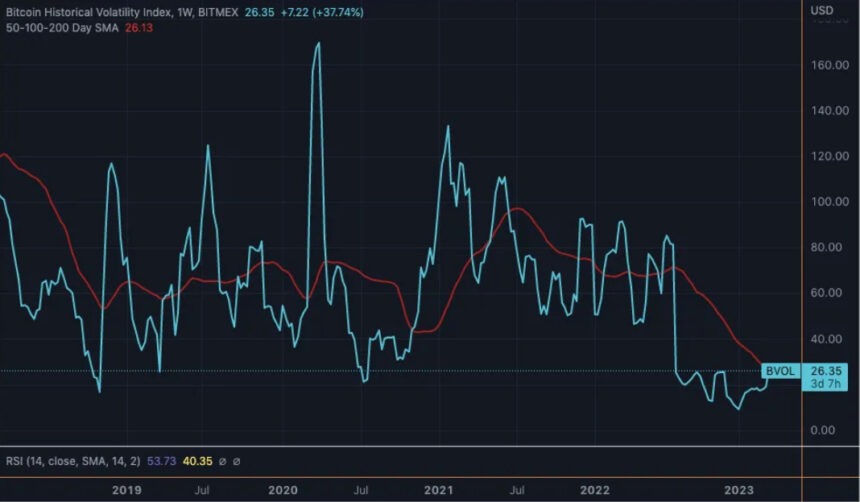
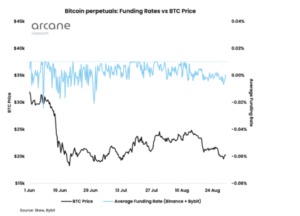
As seen in the chart above, Bitcoin’s Volatility Score, represented by the blue line, is breaking out of its 7-month range and has recently surpassed its 200-day DMA (red line) at 26.13. This suggests that BTC will likely break out of the $15,000-$25,000 range shortly.
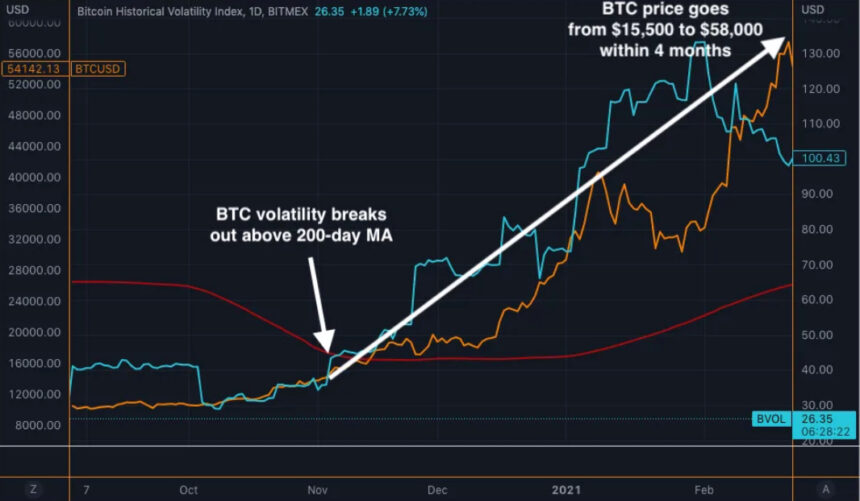
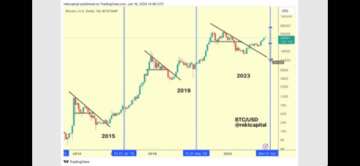
As illustrated in the above chart, there was a significant increase in both volatility and price action from late 2020 to early 2021. Bitcoin broke through the 200-day MA during this period and surged from $15,500 to $58,000 in just four months. This demonstrates the potential for BTC to unleash significant upward momentum in the months ahead. The analyst concluded:
Consider the volatility we experienced in early March as a sample taste of what’s to come. We find ourselves in a Brave New World now, one that BTC was uniquely designed for.
This week, the cryptocurrency market has seen significant volatility. Although Bitcoin has surpassed the $26,000 mark, bears remain hopeful for a return to previous lows, while bulls are optimistic as there is currently no major resistance above $26,000.
Bitcoin continues to post significant gains in all time frames. Currently trading at $26,300, BTC has gained 5.9% in the past 24 hours and 30% in the past seven days.
Featured image from Istock, chart from TradingView.com
- SEO Powered Content & PR Distribution. Get Amplified Today.
- Platoblockchain. Web3 Metaverse Intelligence. Knowledge Amplified. Access Here.
- Source: https://www.newsbtc.com/news/bitcoin/analyst-warns-bitcoin-price-surge-above-26000-could-trigger-volatility-eruption/
- :is
- 000
- 2020
- 2021
- 7
- a
- above
- Action
- After
- ahead
- All
- Although
- analyst
- and
- annual
- approach
- approaches
- ARE
- AS
- At
- average
- BE
- Bear
- Bear Market
- Bears
- become
- believes
- Bitcoin
- Bitcoin Price
- Blue
- Bottom
- brave
- Break
- break out
- Breaking
- breakout
- Broke
- BTC
- btc price
- bull
- Bull Market
- Bulls
- by
- capitalization
- cascade
- chain
- Chart
- come
- concluded
- Confirm
- continue
- continues
- could
- coupled
- critical
- cryptocurrency
- cryptocurrency market
- Current
- Currently
- Days
- Decline
- demonstrates
- designed
- determining
- dma
- during
- Early
- early stage
- Ether (ETH)
- eventually
- experienced
- experiencing
- Find
- First
- first time
- fluctuations
- For
- found
- from
- future
- Gains
- Held
- helped
- High
- Highs
- historically
- Hit
- holds
- HOURS
- However
- HTTPS
- image
- in
- Increase
- Increases
- Indicator
- initial
- interest
- IT
- ITS
- jpg
- lab
- largest
- Last
- Late
- Level
- levels
- likely
- Line
- Liquidation
- liquidations
- Lows
- major
- March
- mark
- Market
- Market Capitalization
- max-width
- might
- Momentum
- Month
- months
- moving
- moving average
- Natural
- New
- NewsBTC
- noted
- of
- on
- ONE
- open
- open interest
- Optimistic
- past
- period
- plato
- Plato Data Intelligence
- PlatoData
- Plummet
- Point
- Post
- potential
- previous
- price
- PRICE ACTION
- price surge
- Prices
- provides
- rallies
- rally
- range
- reach
- reaction
- rebound
- recently
- Red
- remain
- represented
- represents
- Resistance
- return
- Rise
- seven
- sharing
- sharp
- short-term
- Shortly
- significant
- since
- Source
- Stage
- stages
- State
- strong
- such
- Suggests
- support
- support level
- support levels
- surge
- Surged
- surpass
- surpassed
- team
- that
- The
- Through
- time
- to
- towards
- Trading
- TradingView
- Trend
- trigger
- triggering
- uniquely
- unleash
- upward
- upward momentum
- Volatility
- Warns
- week
- which
- while
- will
- with
- world
- year
- zephyrnet