BNB/USD – BNB Battles To Hold 200-day MA Support
Key Support Levels: $260, $255, $225.
Key Resistance Levels: $300, $320, $330.
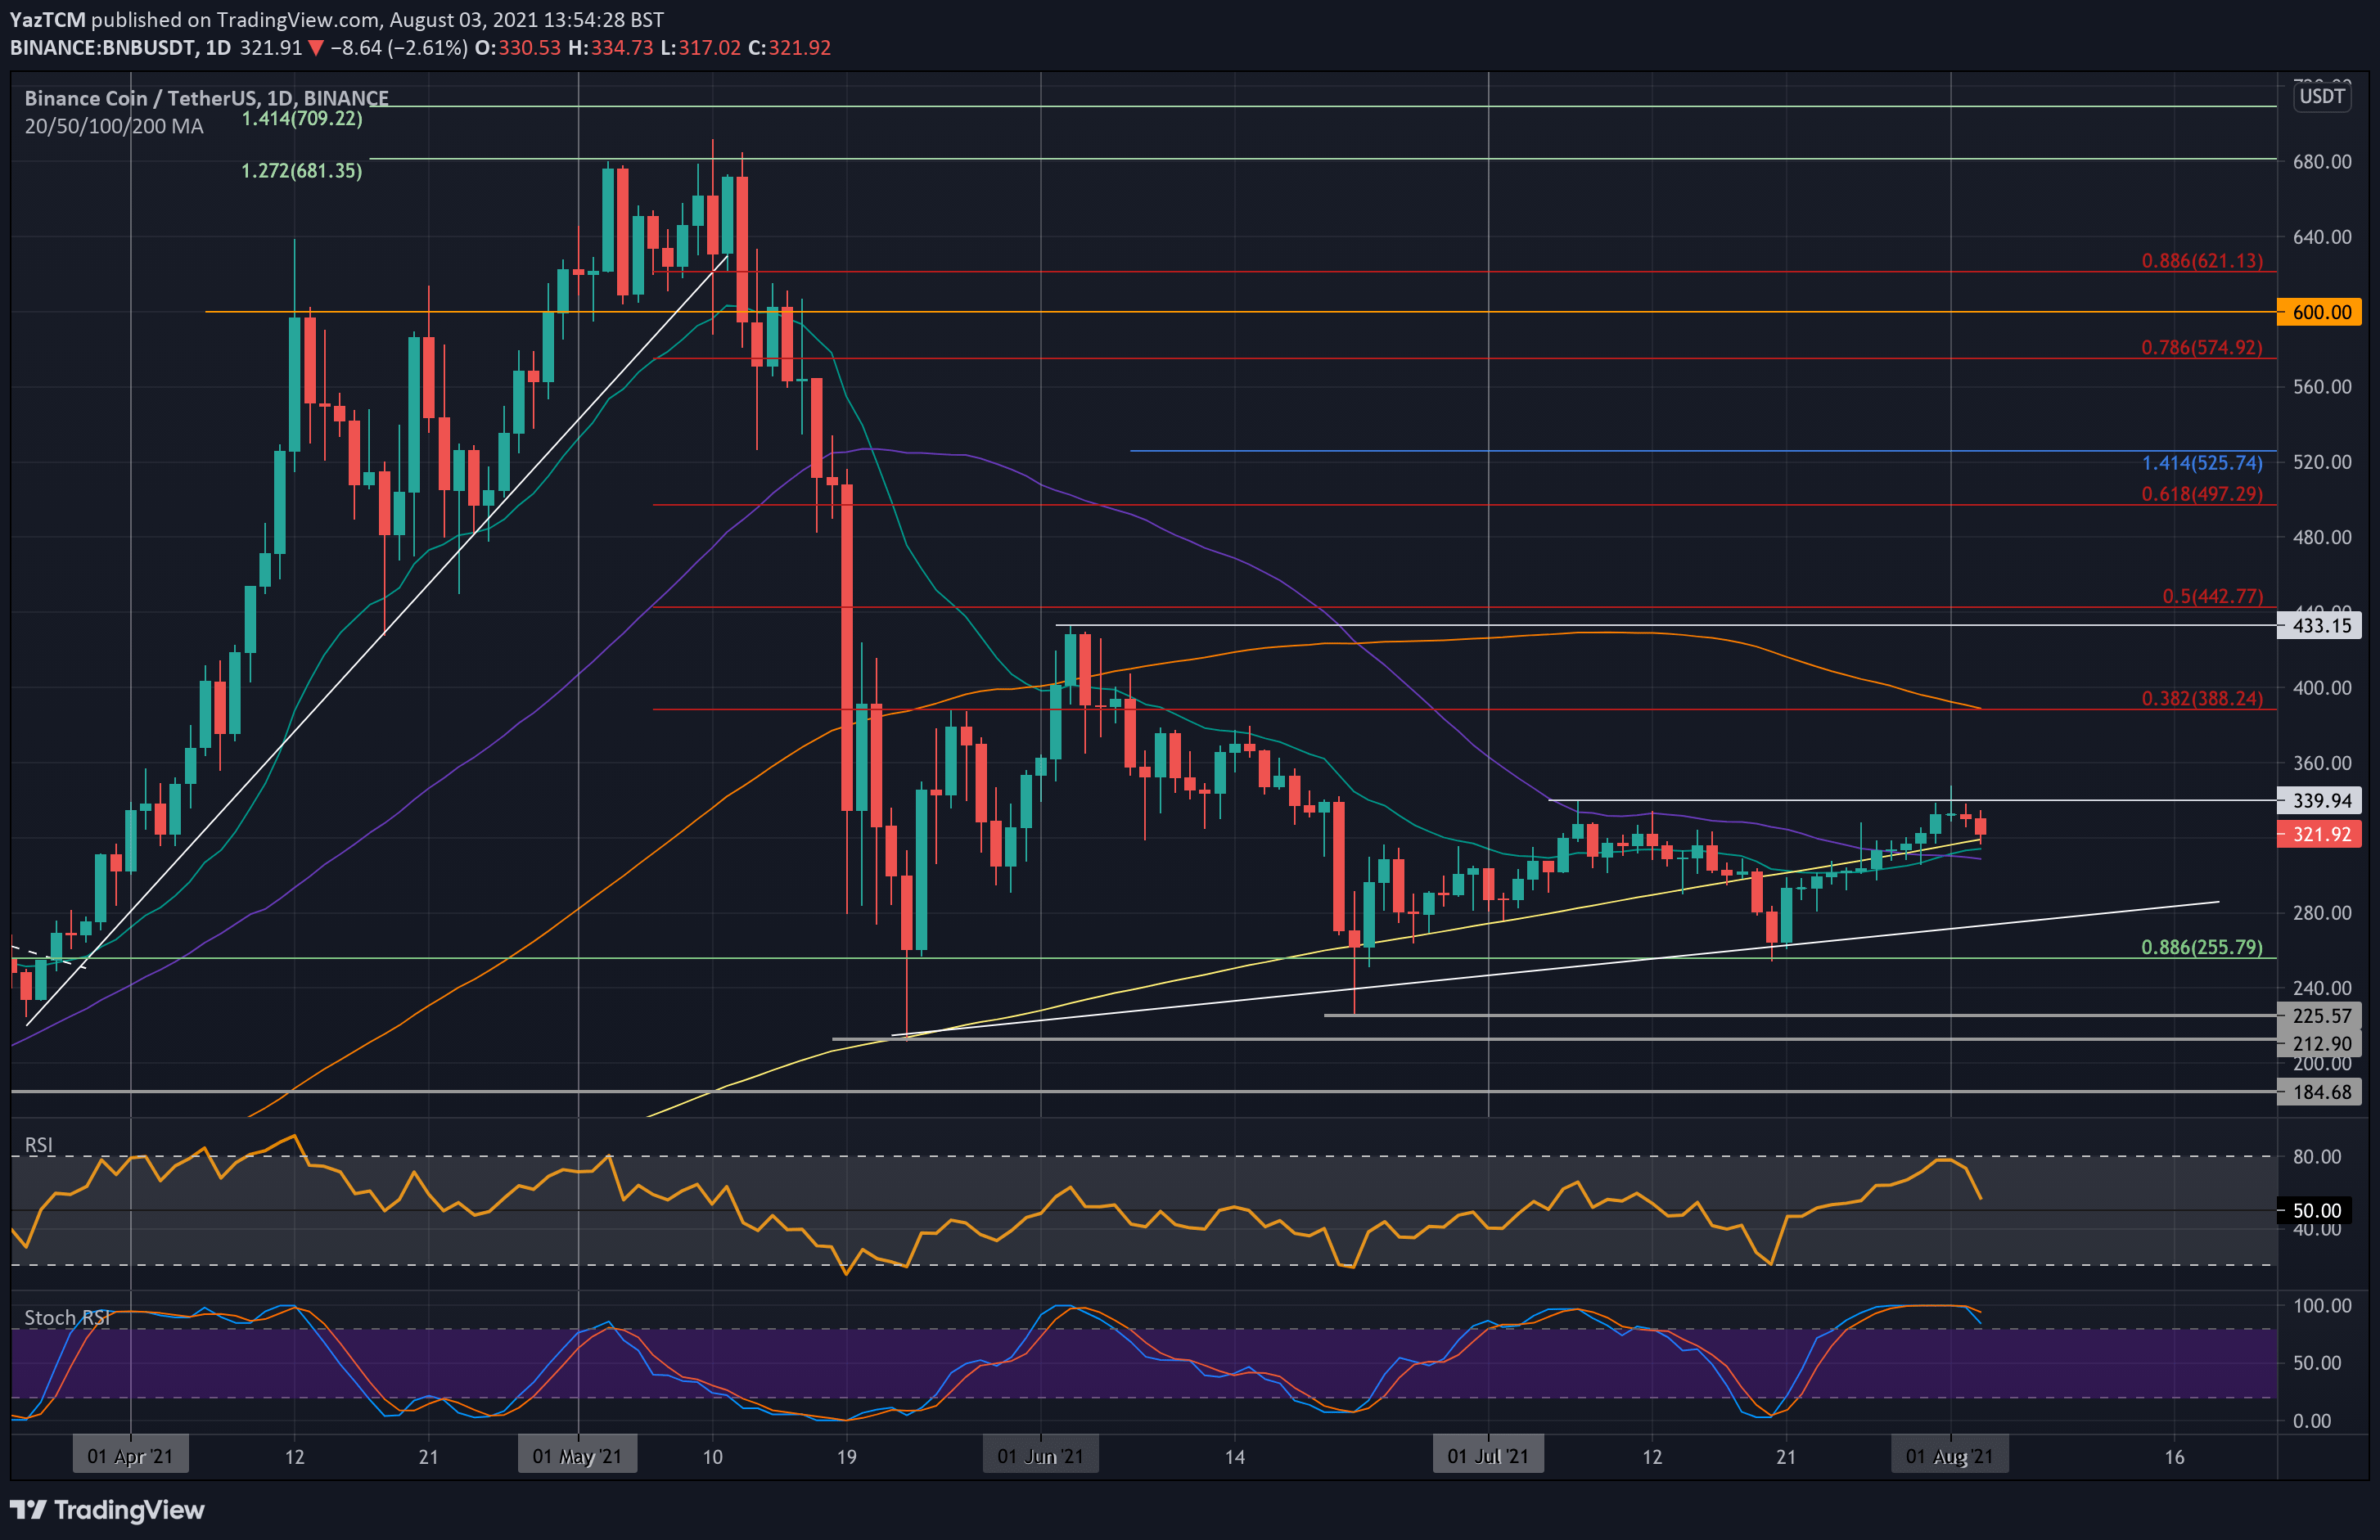
Binance coin has remained relatively stagnant over the past month, being unable to overcome the $340 resistance. The cryptocurrency dipped as low as $255 in July, where it met support at a .886 Fib.
It rebounded from there and started to slowly grind higher to break the 200-day MA and reach the July resistance by the end of the month. In August, BNB did spike as high as $348, but it still fails to close a daily candle above the $340 level.
It has since rolled over from $340 and is testing the 200-day MA support at $320.
BNB-USD Short Term Price Prediction
Moving forward, the first resistance lies at $340 (July resistance). This is followed by $360, $388 (bearish .382 Fib & 100-day MA), and $400.
On the other side, the first support lies at $320 (200-day MA). This is followed by $300, $280, the rising trend line, and $255 (.886 Fib).
The daily RSI rolled over from near overbought conditions this week, indicating the bullish momentum is fading in the short term.
BNB/BTC – BNB Returns To 20-day MA
Key Support Levels: 0.008 BTC, 0.00745 BTC, 0.007 BTC.
Key Resistance Levels: 0.0088 BTC, 0.0093 BTC, 0.0096 BTC.
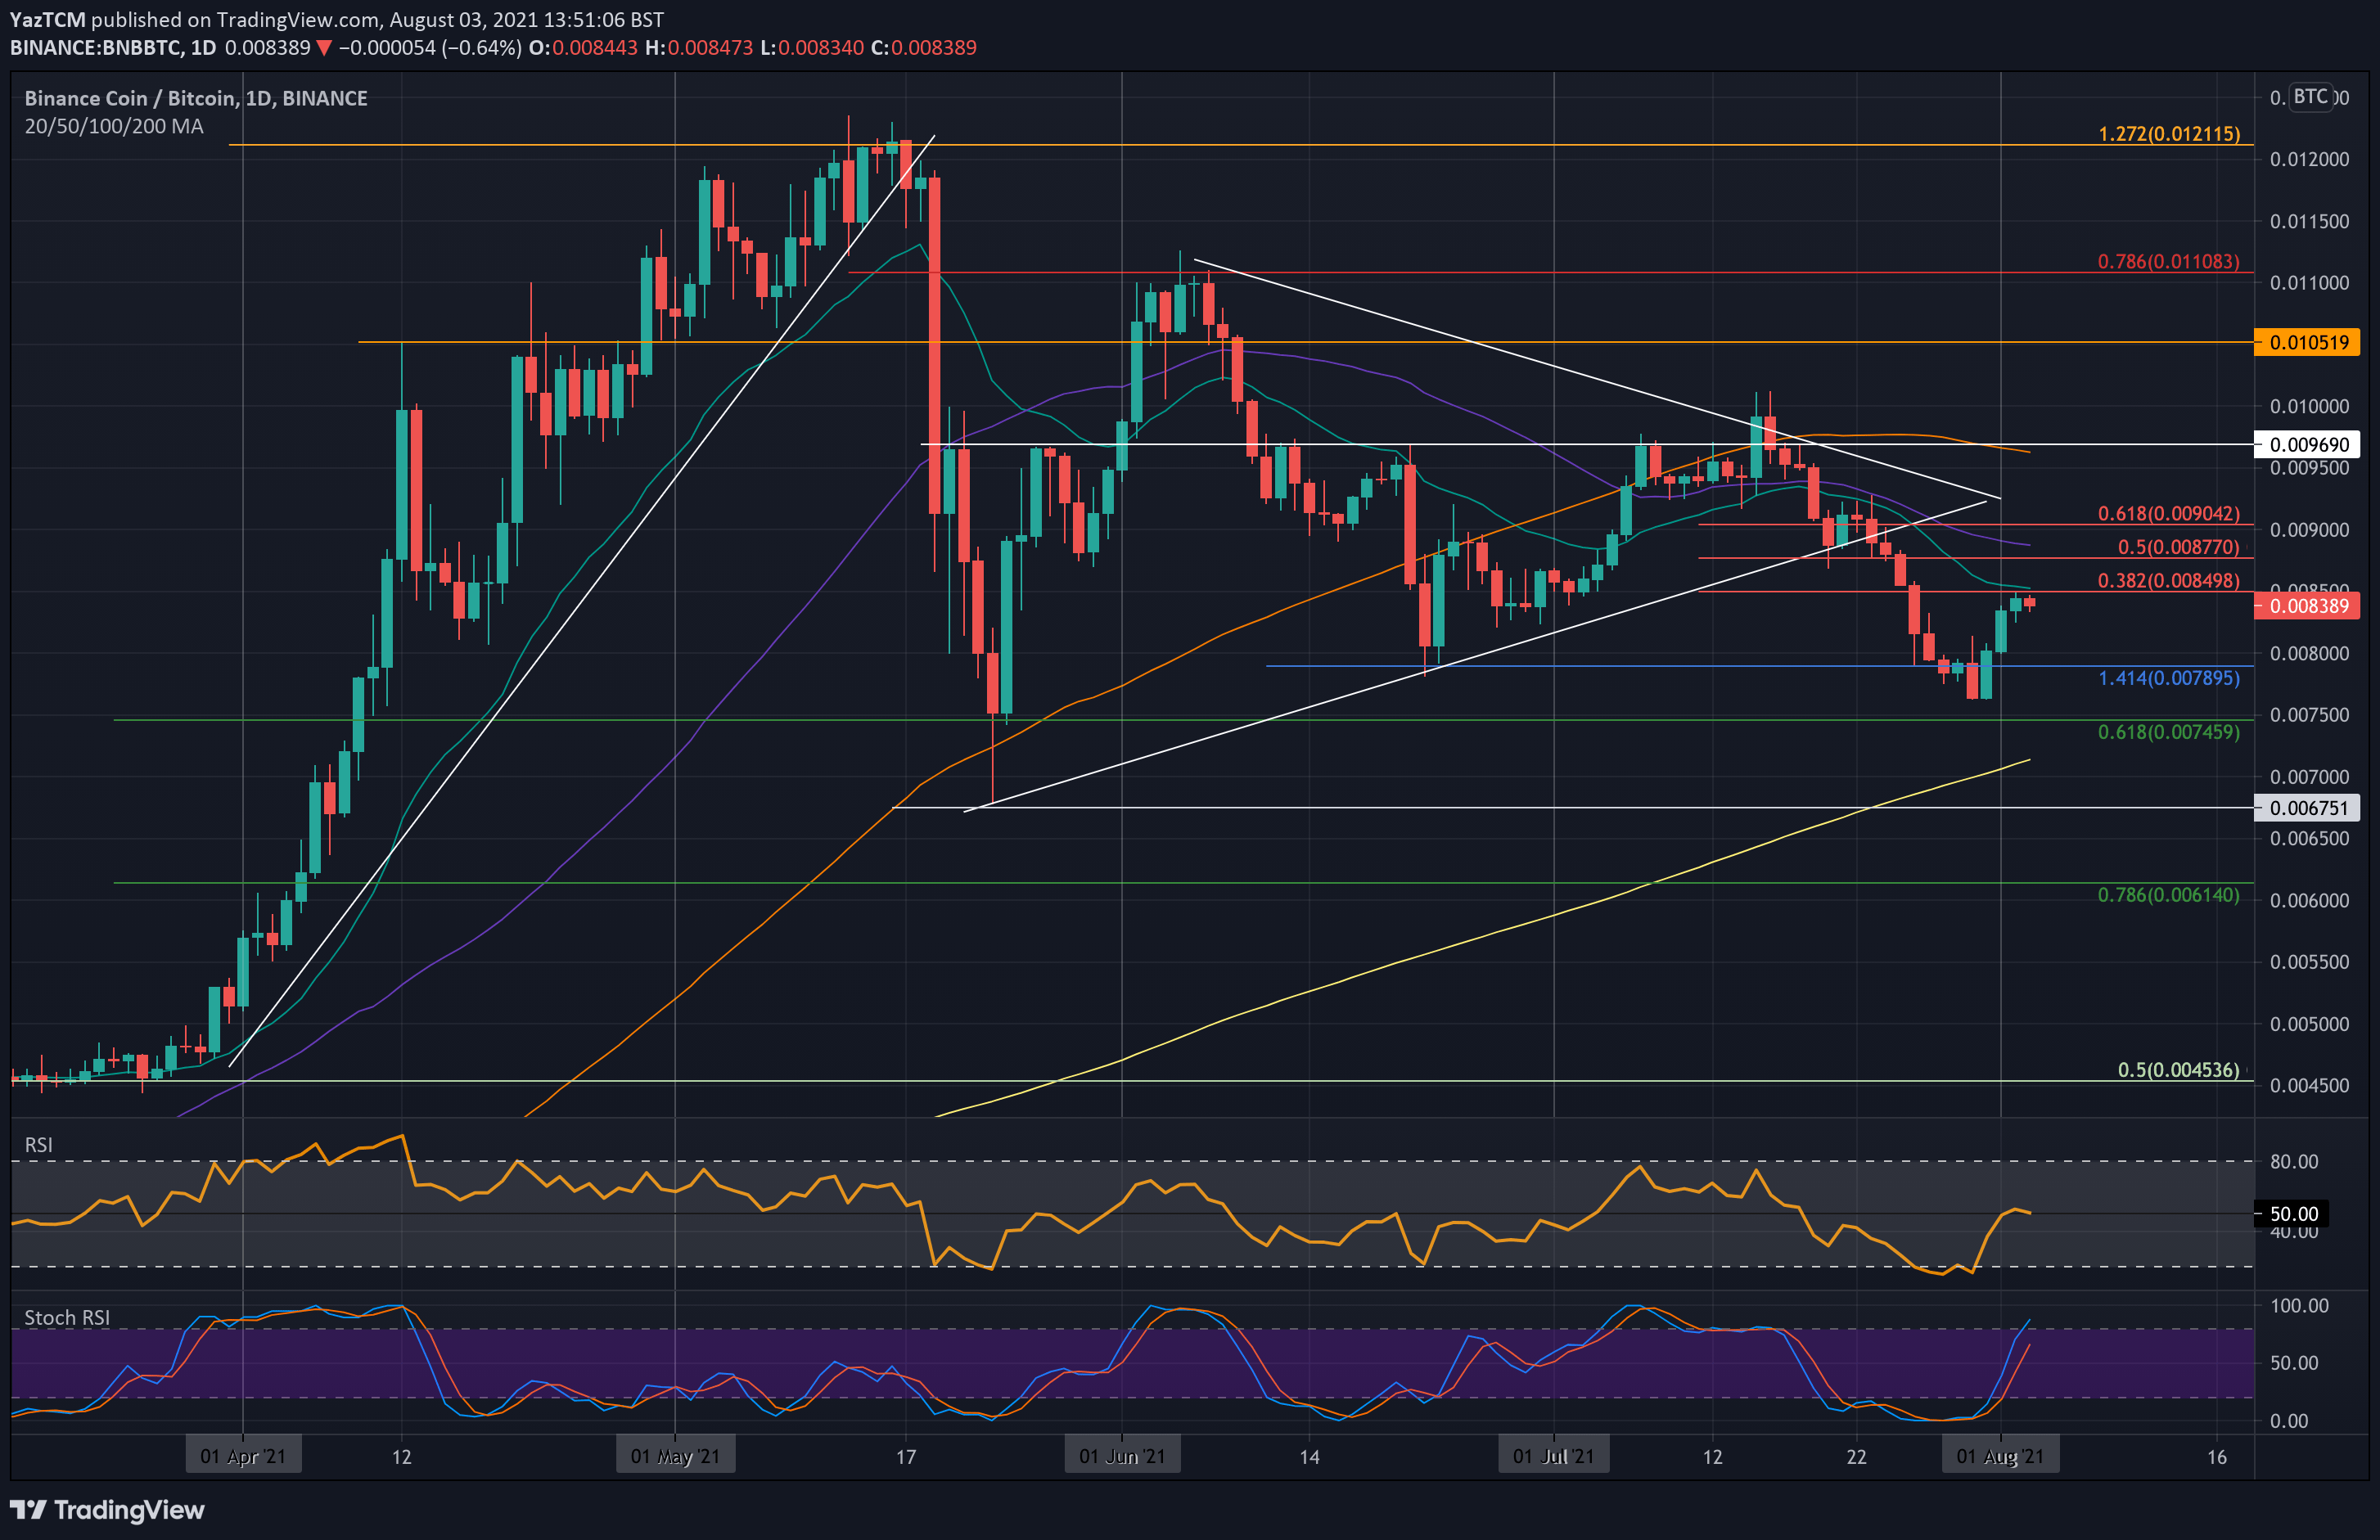
BNB has been struggling against BTC in recent weeks after creating a fresh two-month low toward the end of July. It reached as low as 0.0076 BTC but quickly rebounded from there to climb above 0.008 BTC on the first day of August.
Since breaking 0.008 BTC, BNB continued to climb but is now testing resistance at 0.0085 BTC, provided by a bearish .382 Fib and the 20-day MA.
BNB-BTC Short Term Price Prediction
Looking ahead, the first resistance lies at 0.0085 BTC (20-day MA). This is followed by 0.0088 BTC (bearish .5 Fib & 50-day MA), 0.009 BTC, and 0.0096 BTC (100-day MA).
On the other side, the first solid support lies at 0.008 BTC. This is followed by 0.0076 BTC (July low), 0.00745 BTC (.618 Fib), and 0.0071 BTC (200-day MA).
The daily RSI shows that the bulls are struggling to establish any sort of momentum in the market. The bearish momentum from the end of July has faded, but it looks like the buyers do not currently have any energy to take over the momentum.