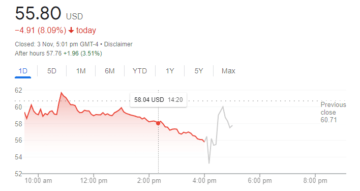
Crypto market volatility continues as the overall cryptocurrency market is down 4.10% slipping once again under $1.4 trillion. At press time, Bitcoin is down 4.22% trading at $32,857 with a market cap of $620 billion.
On the other hand, Ethereum has seen a deeper correction losing 7.79% and slipping under $2000 levels. At press time, ETH is trading 7.7% down at a price of $1982 with a market cap of $237 billion.
In a recent to investors, Rich Ross, technical strategist at Evercore ISI wrote that Bitcoin’s recent price action shows “a menacing chart full of sound and fury, backed by nothing”. On the upside, the first resistance is at $36,000. On the downside, the first support is $33,000 followed by $30,000 as the next. If Bitcoin breaks $30,000 support, we can see it heading to $22,000 and even below says Ross.
On the other hand, Ross believes that Ether is more constructive relatively “especially above $2,400”. Although ETH made an attempt to move past $2400 levels last week, it faced strong rejection. If we look at the weekly charts, the ETH price is down by around 15%.
Next Direction for Bitcoin and Ethereum
As the world’s two largest cryptocurrency shows signs of heightened volatility, investors have been confused about their next price action. Earlier this year, the year-to-date gains for BTC were exceeding the S&P 500 by a great margin. However, it has turned negative amid the recent correction while stocks continue to rise further.

Bloomberg states that there could be a pickup in the BTC price citing the coiling around of Bollinger bands around BTC price. The publication notes:
“The bandwidth, defined by the percentage difference between the upper and lower bands, is flirting with year-to-date lows, while the 14-day Average True Range is close to its lowest levels of the year”.
Along with the S&P 500, Bitcoin’s 6-day correlation with the Spot Gold price has turned negative, Bloomberg writes that this could be a positive sign as a lower correlation makes the asset more desirable for diversification purposes.
Coming to Ethereu, the good thing is that it has been trading above its 200-day moving average. But the 50-DMA chart shows that $2300 could serve as a strong resistance.
Subscribe to our newsletter for free

- 000
- 7
- Action
- Ads
- around
- asset
- avatar
- Billion
- Bitcoin
- Bitcoin BTC
- blockchain
- blockchain technology
- Bloomberg
- border
- BTC
- btc price
- Charts
- Coingape
- content
- continue
- continues
- cryptocurrencies
- cryptocurrency
- cryptocurrency market
- diversification
- Economics
- ETH
- eth price
- Ether
- ethereum
- ethereum (ETH)
- finance
- financial
- fintech
- First
- flair
- Free
- full
- Gold
- gold price
- good
- great
- hold
- HTTPS
- interest
- investing
- Investors
- IT
- Key
- knowledge
- learning
- Market
- Market Cap
- market research
- Markets
- move
- Newsletter
- Opinion
- Other
- Pickup
- press
- price
- range
- research
- S&P 500
- Share
- Signs
- skills
- Spot
- States
- Stocks
- support
- Technical
- Technology
- time
- Trading
- Volatility
- Watch
- week
- weekly
- year