- Bitcoin cash price started a fresh decline from the $400 resistance against the US Dollar.
- The price is now trading below the $380 zone and the 55 simple moving average (4-hours).
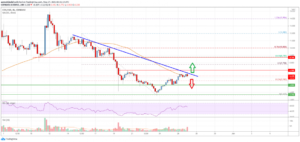
- There was a break below a key bullish trend line with support near $365 on the 4-hours chart of the BCH/USD pair (data feed from Coinbase).
- The pair could continue to move down if there is a break below the $332 support zone.
Bitcoin cash price is showing bearish signs below $380 against the US Dollar, similar to bitcoin. BCH/USD could extend losses unless there is a move above $370.
Bitcoin Cash Price Analysis
Bitcoin cash price started a major decline from the $400 resistance zone. BCH price declined below the $380 support and the 55 simple moving average (4-hours).
Besides, there was a break below a key bullish trend line with support near $365 on the 4-hours chart of the BCH/USD pair. The pair even spiked below the $350 level. A low is formed near $338, and the price is now consolidating losses.
An immediate hurdle on the upside is near the $350 level. It is near the 23.6% Fib retracement level of the downward move from the $398 swing high to $338 low.
The next major resistance is near the $370 level. It is near the 50% Fib retracement level of the downward move from the $398 swing high to $338 low. A clear break above $370 and $380 might spark a fresh rally.
In the stated case, the price could rise towards the $400 level. An initial support is near the $335 level. The first major support is near the $325 level. A downside break below the $325 and $320 support levels might start a major decline.
The next major support is near the $300 level, below which the bears might aim a test of $280. Any more downsides might lead the price towards the $250 level.

Bitcoin Cash Price
Looking at the chart, bitcoin cash price is now trading below the $380 zone and the 55 simple moving average (4-hours). Overall, the price could continue to move down if there is a break below the $332 support zone.
Technical indicators
4 hours MACD – The MACD for BCH/USD is slowly gaining pace in the bearish zone.
4 hours RSI (Relative Strength Index) – The RSI for BCH/USD is now below the 50 level.
Key Support Levels – $332 and $320.
Key Resistance Levels – $370 and $400.
The post Bitcoin Cash Analysis: Risk of Drop To $300 appeared first on Live Bitcoin News.
Source: https://www.livebitcoinnews.com/bitcoin-cash-analysis-risk-of-drop-to-300/