On-chain data suggests that dumping from 11-year old coins worth $20 million may be behind the recent Bitcoin price drop.
11-Year Old Bitcoin Moved Shortly Before The Drop below $40k
As pointed out by an analyst in a CryptoQuant post, a large amount of dormant coins since eleven years ago seems to have moved a bit before today’s drop below the $40k level.
The relevant indicator here is the “coin days destroyed” (CDD) metric. “Coin days” are defined as the number of days that a Bitcoin remains unspent for.
When 1 BTC remains still for one day, it accumulates 1 coin day. Similarly, 0.5 BTC would accumulate 1 coin day only after it hasn’t moved for two days.
Once these coins are spent or transferred, the coin days are said to be “destroyed” as the number of them reset back to zero. The number of such days destroyed is what the CDD indicator measures.
When the metric shows a large spike in its value, it means a large amount of dormant coins have just been moved. This can indicate dumping from long-term holders, a bearish sign for the price of Bitcoin.
Related Reading | Data: Bitcoin Transaction Fees Registers Unusually Low Values For 7th Straight Month
Now, here is a chart that shows the trend in the BTC CDD over the past day:
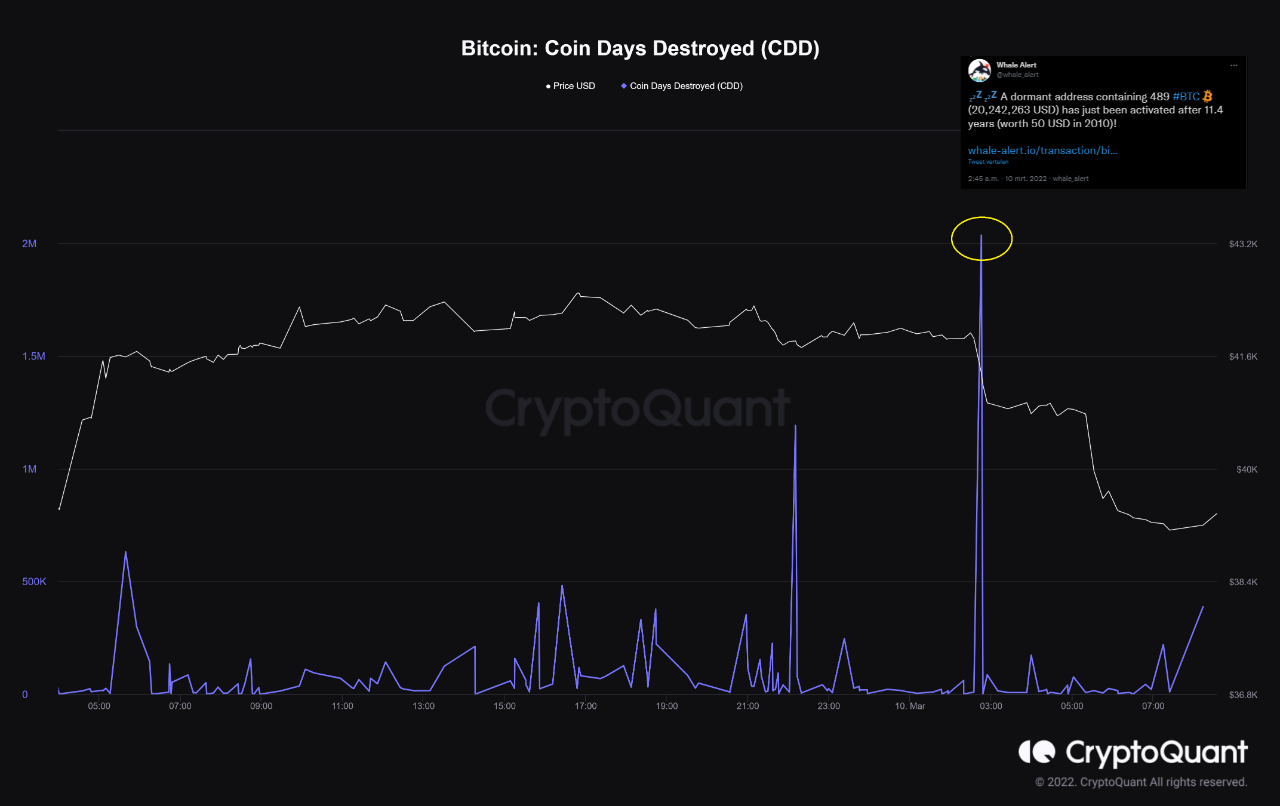
The indicator's value seems to have shown a large spike recently | Source: CryptoQuant
As you can see in the above graph, the BTC CDD metric’s value shot up recently. According to the quant, the spike is due to a movement of an 11-year old BTC stash with 489 coins, worth only $50 in 2010 when it went dormant, but today values over $20 million.
Related Reading | Binance’s Bitcoin Dominance Sharply Rises, Now Holds 22.6% Of Total Exchange Supply
This movement in these old coins looks to have happened shortly before the decline in the price of BTC earlier today, making it seem logical that these coins being dumped may be one of the factors behind the drop,
BTC Price
At the time of writing, Bitcoin’s price floats around $39k, down 10% in the last seven days. Over the past month, the crypto has lost 11% in value.
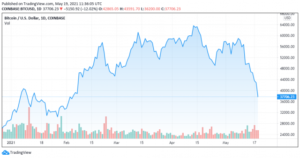
The below chart shows the trend in the price of the coin over the last five days.
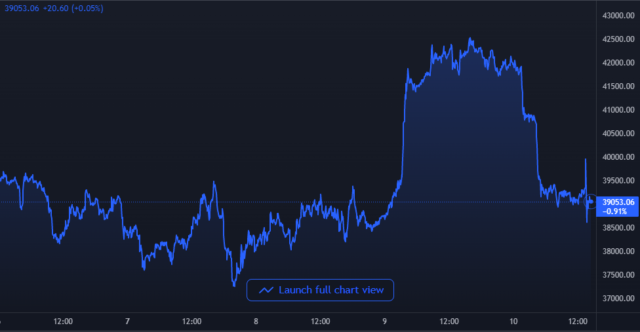
Looks like the price of BTC has plunged down over the past twenty-four hours | Source: BTCUSD on TradingView
After a few days of sideways movement, Bitcoin finally showed some sharp uptrend yesterday and broke above the $42k mark. But it didn’t last for long.
Today, the crypto has come back down to the sub $40k levels and it’s unclear at the moment when some real recovery may be seen because of the uncertainty caused by the Russian invasion of Ukraine.
Featured image from Unsplash.com, charts from TradingView.com, CryptoQuant.com
- According
- amount
- analyst
- around
- bearish
- being
- Bit
- Bitcoin
- Bitcoin Price
- BTC
- caused
- Charts
- Coin
- Coins
- crypto
- data
- day
- destroyed
- down
- Drop
- eleven
- exchange
- factors
- Fees
- Finally
- here
- holds
- HTTPS
- image
- IT
- large
- Level
- Long
- Making
- mark
- million
- Month
- movement
- number
- price
- Reading
- recovery
- Said
- Stash
- time
- today
- transaction
- Ukraine
- Unsplash
- value
- What
- worth
- writing
- years
- zero