SNEAK PEEK
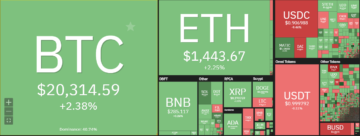
- Bitcoin (BTC) breaks a 9-month high, reaching $27,000 for the first time.
- Market capitalization and trading volume increase, signaling investors’ rising interest.
- Bulls in control with positive momentum, suggesting a possible rise toward $30K.
Despite a negative start, Bitcoin (BTC) bulls have reversed the trend, propelling the price from an intra-day low of $26,019.35 to a new 90-day high of $27,787.81 in the previous 24 hours. This bullish force, which has seen Bitcoin reach $27,000 for the first time in 9 months, has resulted in 2.4x the number of profit transactions on the BTC/USD network since Wednesday.
The market capitalization and 24-hour trading volume increased by 4.47% and 21.38%, respectively, to $528,715,680,513 and $47,525,714,373. This increase demonstrates investors’ rising interest and trust in the market, signalling the possibility of more expansion and development in the foreseeable future.
If bullish power breaks over the $27,787.81 resistance level, the next barrier levels might be around $30,000 and $32,000, attracting additional investors and pushing the market higher. But, if negative pressure prevails and the price falls below the $25,000 support level, it might suggest a trend reversal and further decline.
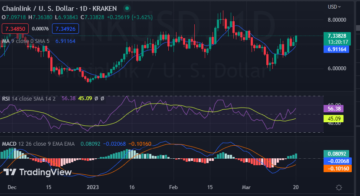
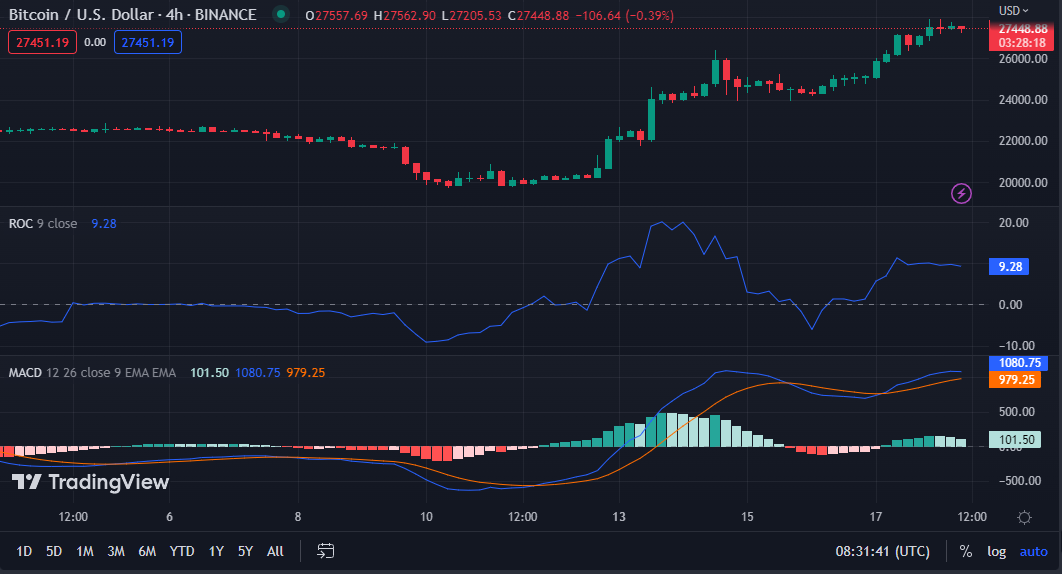
The Rate of Change (ROC) on the BTC/USD chart is 9.05, indicating that bulls are now in charge of the market and that bullish momentum is rising. This ROC level indicates that purchasing pressure is building, and traders may want to consider taking long positions since the market is indicating a possible rise.
Therefore, it is critical to regularly watch price movement and establish proper stop-loss levels to mitigate risk in a rapid shift in market sentiment.
The MACD line moving above its signal line and reading 1078.61 supports the market’s positive momentum, signalling a possible purchasing opportunity.
The histogram’s movement into the positive territory supports this optimistic picture, indicating that purchasing pressure is rising. The trend may continue soon, making it an attractive moment for investors to consider joining the market.
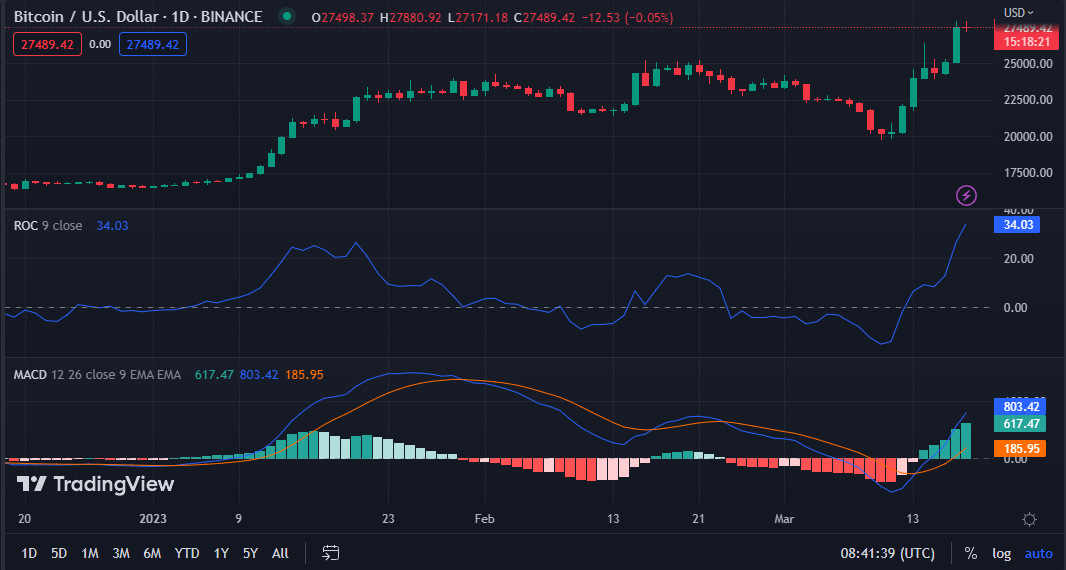
In the 24-hour price chart, the ROC is 33.83 and moving north, indicating that the bullish momentum is gaining strength. Traders may perceive this as a signal to open a long position and ride the rising trend. This movement suggests that the bullish momentum will likely stay, raising the likelihood of BTC bulls smashing resistance and targeting the 30K level.
Also, the MACD line has crossed above its signal line, indicating a long bull run. In the BTCUSD 24-hour price chart, the MACD line is 802.61, while the signal line is 618.31.
This movement suggests that the BTCUSD may have a bullish trend in the near future since the MACD line crossing above the signal line is considered a buy signal.
Bitcoin bulls come back, smashing resistance and propelling the price to a new 90-day high. Will the bullish momentum continue?
Disclaimer: Cryptocurrency price analysis is highly speculative and volatile and should not be considered financial advice. Past and current performance is not indicative of future results. Always do your research and consult with a financial advisor before making investment decisions.
- SEO Powered Content & PR Distribution. Get Amplified Today.
- Platoblockchain. Web3 Metaverse Intelligence. Knowledge Amplified. Access Here.
- Source: https://investorbites.com/bitcoin-btc-price-analysis-18-3/
- :is
- 000
- 1
- 9
- a
- above
- Additional
- advice
- advisor
- always
- analysis
- and
- ARE
- around
- AS
- attracting
- attractive
- back
- barrier
- BE
- before
- below
- Bitcoin
- Bitcoin News
- Bitcoin Price
- Bitcoin Price Analysis
- breaks
- BTC
- BTC/USD
- BTCUSD
- Building
- bull
- Bull Run
- Bullish
- Bulls
- buy
- by
- capitalization
- change
- charge
- Chart
- come
- Consider
- considered
- continue
- control
- critical
- Crossed
- cryptocurrency
- Current
- decisions
- Decline
- demonstrates
- Development
- establish
- Ether (ETH)
- expansion
- eye
- Falls
- financial
- First
- first time
- For
- For Investors
- Force
- foreseeable
- from
- further
- future
- gaining
- Have
- High
- higher
- highly
- HOURS
- HTTPS
- in
- Increase
- increased
- indicates
- interest
- internal
- investment
- Investors
- IT
- ITS
- joining
- Level
- levels
- likely
- Line
- Long
- Low
- MACD
- Making
- Market
- Market Capitalization
- Market News
- market sentiment
- might
- Mitigate
- moment
- Momentum
- months
- more
- movement
- moving
- Near
- negative
- network
- New
- news
- next
- North
- number
- of
- on
- open
- Opportunity
- Optimistic
- past
- performance
- picture
- plato
- Plato Data Intelligence
- PlatoData
- position
- positions
- positive
- possibility
- possible
- power
- pressure
- previous
- price
- Price Analysis
- price chart
- Profit
- propelling
- proper
- purchasing
- Pushing
- raising
- rapid
- Rate
- reach
- reaching
- Reading
- regularly
- research
- Resistance
- Results
- Reversal
- Ride
- Rise
- rising
- Risk
- Run
- sentiment
- set
- shift
- should
- Signal
- since
- Soon
- Source
- start
- stay
- strength
- Suggests
- support
- support level
- Supports
- taking
- targeting
- that
- The
- time
- to
- toward
- Traders
- Trading
- trading volume
- TradingView
- Transactions
- Trend
- Trust
- volatile
- volume
- Watch
- Wednesday
- What
- What is
- What is bitcoin
- which
- while
- will
- with
- Your
- zephyrnet