SNEAK PEEK:
- Bitcoin has crossed the golden cross over the last 24 hours.
- The BTC market has been trading with bullish sentiment over the previous 24 hours.
- Bulls in the BTC market have established support levels at $24,428.63.
According to a recent tweet by the ₿irb Nest, a high-quality international trade association, Bitcoin has formed a golden cross, indicating that the bulls have recently taken control of the market. When the 50-day moving average (MA) crosses over the 200-day MA, it forms a golden cross. This is a fantastic indicator for investors and traders since it signals that now is an excellent time to enter the market.
The bullish setup is additionally empowered by the golden cross, where the 200-day trend was crossed over the 50-day moving average, generating a buy signal on the daily time frame for the first time since September 2021 $BTC. pic.twitter.com/JsqKT0bwWM
— The ₿irb Nest (@TheBirbNest) February 20, 2023
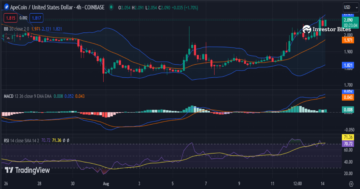
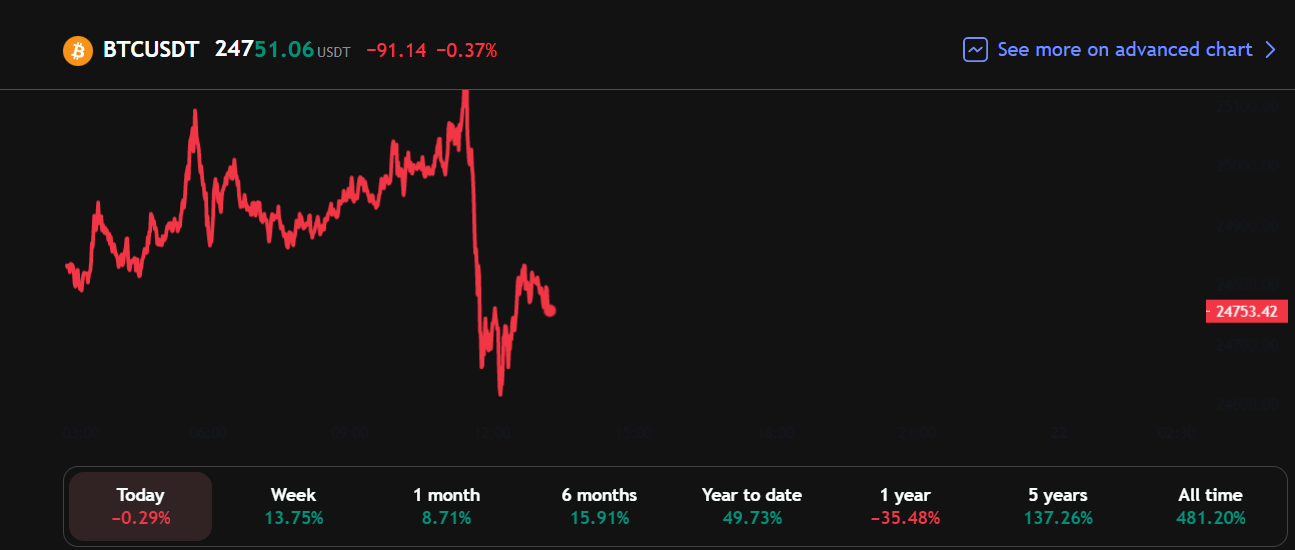
Bitcoin (BTC) price started trading optimistically, with bulls dominating the market in the last 24 hours. Since the BTC price has continuously grown, bulls have established a support level of $24,428.63 and a resistance level of $25,126.85. Bitcoin is trading at $24,814.50, a 1.08% rise over the previous trading day.
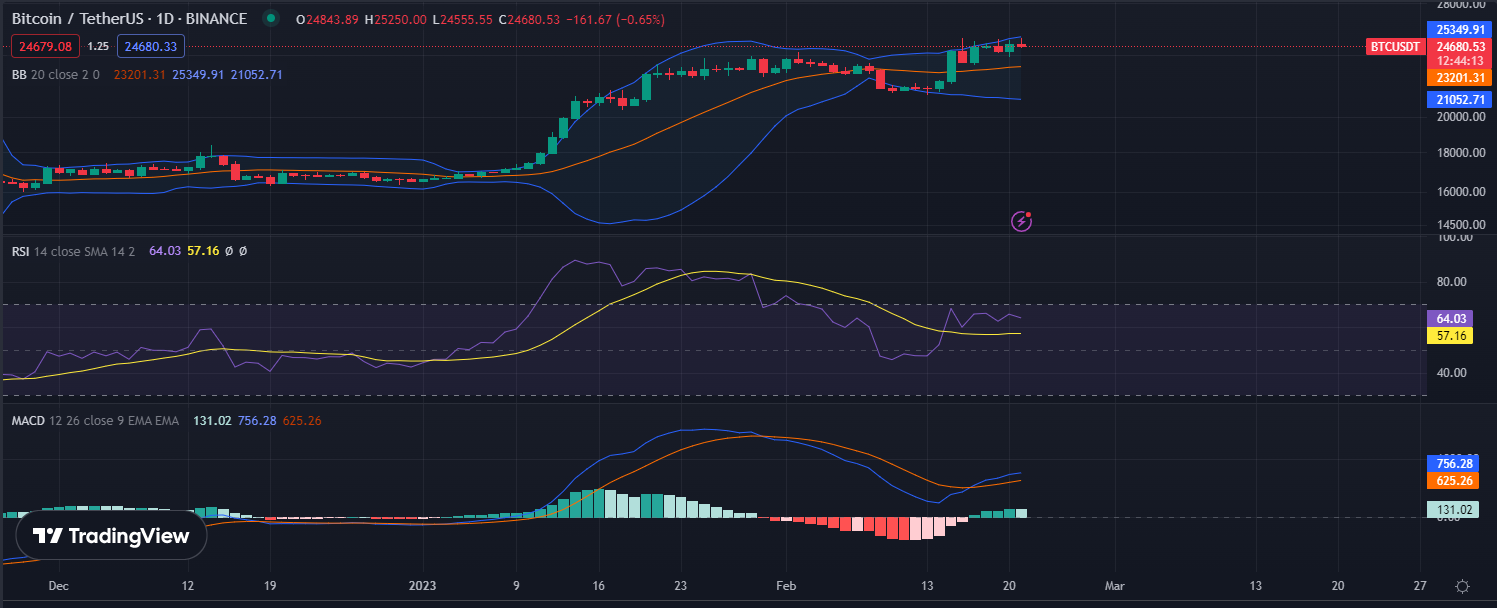
Bullish sentiment in the BTC market is indicated by the Relative Strength Index (RSI) in the 24-hour time frame, which has a reading of 64.48, meaning that prices have risen significantly quickly. Furthermore, the RSI line also indicates bullish sentiment, which is moving above its signal line, indicating that the bullish optimism in the BTC market may continue in the coming hours.
The Moving Average Convergence Divergence (MACD) indicator, trending in the positive region, also demonstrates the bullish dominance in the BTC price. The MACD line is currently reading 757.43, higher than the 9-day exponential moving average of 712.91. Creating the trajectory histogram in the positive region indicates buyers have the upper hand in this market, and prices may rise further if the current trend continues.
The broadening of the Bollinger Band indicates that the current bullish trend in the BTC market may continue shortly. However, the upper band is currently at 25352.21, while the lower band is at 21052.61, indicating substantial volatility in the BTC market. This may benefit traders and investors wanting to capitalize on potential gains.
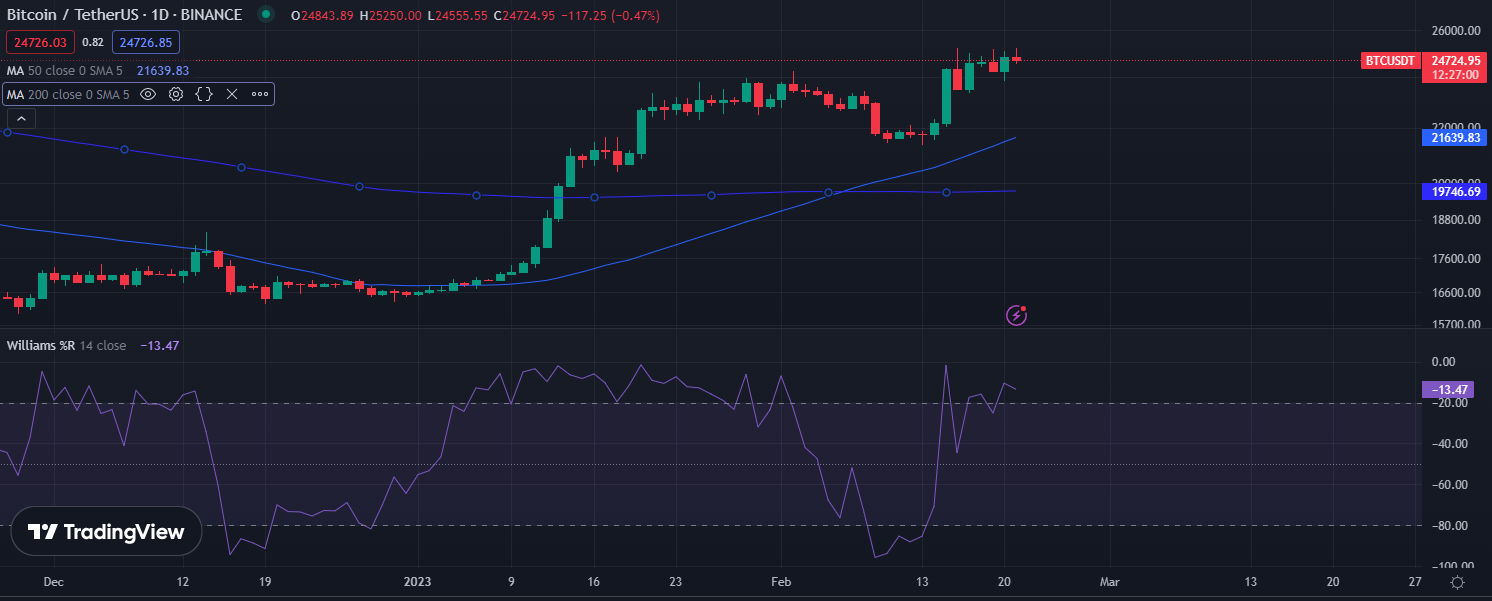
The intensity of the bullish trend is also shown by the fact that the 50-day moving average has crossed over the 200-day MA. This indicates strong upward momentum in the market and that the bulls have dominated the BTC market. Consequently, the bullish sentiment regarding Bitcoin prices may continue in the short run.
The William Percentage (William%R) Indicator has a reading of -13.17, close to the neutral zone of “0,” indicating that the BTC market is bullish and may continue in the hours ahead. A result near the neutral zone of 0 does not ensure an upward trend in the market.
In conclusion, Bitcoin price analysis today indicates that the price of BTC is in bullish sentiment and that this might continue in the BTC market in the hours ahead.
- SEO Powered Content & PR Distribution. Get Amplified Today.
- Platoblockchain. Web3 Metaverse Intelligence. Knowledge Amplified. Access Here.
- Source: https://investorbites.com/bitcoin-btc-price-analysis-21-2/
- 1
- 10
- 2021
- a
- above
- Additionally
- ahead
- analysis
- and
- Association
- average
- BAND
- benefit
- Bitcoin
- Bitcoin News
- Bitcoin Price
- Bitcoin Price Analysis
- Bitcoin prices
- BTC
- btc price
- BTC/USDT
- Bullish
- Bulls
- buy
- buyers
- capitalize
- Center
- Chart
- Close
- coming
- conclusion
- Consequently
- continue
- continues
- continuously
- control
- Convergence
- Creating
- Cross
- Crossed
- Current
- Currently
- daily
- day
- demonstrates
- Divergence
- Dominance
- empowered
- ensure
- Enter
- established
- Ether (ETH)
- excellent
- exponential
- exponential moving average
- external
- fantastic
- First
- first time
- For Investors
- formed
- forms
- FRAME
- further
- Furthermore
- Gains
- generating
- Golden
- golden cross
- grown
- hand
- here
- high-quality
- higher
- HOURS
- However
- HTTPS
- important
- in
- index
- indicates
- Indicator
- internal
- International
- International Trade
- Investors
- IT
- Last
- Level
- levels
- Line
- MACD
- Market
- Market News
- meaning
- might
- Momentum
- moving
- moving average
- Near
- Nest
- Neutral
- news
- Optimism
- percentage
- plato
- Plato Data Intelligence
- PlatoData
- positive
- potential
- previous
- price
- Price Analysis
- price chart
- Prices
- quickly
- Reading
- recent
- recently
- regarding
- region
- relative strength index
- Relative Strength Index (RSI)
- Resistance
- result
- reveal
- Revealed
- Rise
- Risen
- rsi
- Run
- sentiment
- September
- setup
- Short
- Shortly
- shown
- Signal
- signals
- significantly
- since
- Source
- stablecoin
- started
- stay
- strength
- strong
- substantial
- support
- support level
- support levels
- The
- time
- to
- today
- trade
- Traders
- Trading
- TradingView
- trajectory
- Trend
- trending
- tweet
- upward
- upward momentum
- Volatility
- wanting
- What
- What is
- What is bitcoin
- which
- while
- zephyrnet