TL;DR Breakdown
- Bitcoin price analysis shows that Bitcoin is engulfed in a bearish movement.
- The bearish movement started on the 7th of September with a flash crash.
- Strong support is currently found at the $46,000 mark.
- Strong resistance is currently found at the $47,320 mark.
Bitcoin price analysis reveals that the king of cryptocurrency is engulfed in a bearish momentum that started with a flash crash on the 7th of September. The king of cryptocurrency has been trying to recover past the $47,000 mark since the flash fall to the $43,000 level. During the past 24 hours, Bitcoin’s price has been down by 0.21 percent, and it is down by 6.27 percent on the seven-day chart. The king is keeping the market in overall bearish momentum with hints of bullish sprints here and there.
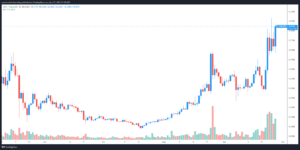
Bitcoin price analysis 1-day candlestick shows increase in volatility
The one-day candlestick Bitcoin price analysis shows that the volatility is slightly increasing on the one-day chart analysis compared to the past few days. The upper Bollinger band, marking the strongest resistance, is found at the $52,094 mark. While the lower Bollinger band, marking the strongest support, is found at the $45,073 level.

The nine-day moving average (MA) and the Bollinger bands’ average are still presenting bearish crossover serving as strong resistance points for the king of cryptocurrency. The nine-day MA is found at the $48,818 mark, while the Bollinger bands’ average is found at the $48,584 mark. The relative strength index is found at the neutral value of 46.57, providing ample opportunity for improvement to the bullish side.
BTC/USD 4 hour candlestick shows decrease in volatility
Although the one-day chart shows a slight increase in volatility, the four-hour candlestick Bitcoin price analysis chart shows a decrease in volatility on the four-hour chart patterns. The upper Bollinger band coming close to the lower is found at the $50,203 mark, while the current price is fluctuating at the time of writing. The lower Bollinger band, marking the strong support point, is found at the $43,551 mark.

Both the nine-day MA and the Bollinger bands’ average are found above the current price marking bearish crossovers and strong resistance points for the king. The MA is found at the $46,370 mark, while the Bollinger bands’ average is found above it, at the $46,877 mark. The RSI is leaning towards the bearish side with a score of 36.87.
Bitcoin price analysis conclusion
Bulls and bears are struggling to gain momentum of the Bitcoin price charts and, in turn, the overall market movement, but so far, it is a tough fight between the two trends. Bitcoin is showing good support for the $46,000 high and holding it strongly amidst slight fluctuations below the $46,000 mark. On the other hand, the market is still suffering from losses due to the $7000 Bitcoin crash on the 7th of September. If the current support levels persist, the king of cryptocurrency is likely to maintain the current price level to retest the $47,000 high. If the current support levels falter, Bitcoin is then likely to falter on the price chart falling back into the $45,800 range or lower.
Disclaimer. The information provided is not trading advice. Cryptopolitan.com holds no liability for any investments made based on the information provided on this page. We strongly recommend independent research and/or consultation with a qualified professional before making any investment decisions.
Source: https://api.follow.it/track-rss-story-click/v3/tHfgumto13AYo57b44aRSSuZukmJ4mr4
- 000
- advice
- analysis
- bearish
- Bearish Momentum
- Bears
- Bitcoin
- Bitcoin Price
- BTC
- Bullish
- Charts
- coming
- Crash
- cryptocurrency
- Cryptopolitan
- Current
- data
- Flash
- good
- here
- High
- HTTPS
- Increase
- index
- information
- investment
- Investments
- IT
- keeping
- King
- Level
- liability
- Making
- mark
- Market
- Momentum
- Opportunity
- Other
- price
- Price Analysis
- range
- Recover
- research
- serving
- So
- started
- support
- time
- Trading
- Trends
- value
- Volatility
- writing