TL;DR Breakdown
- Bitcoin price analysis reveals that Bitcoin is now stable above the $46,000 range.
- A big flash crash of over seven thousand dollars pushed the coin into bears.
- Strong support is currently found at the $45,550 mark.
- Strong resistance is currently found at the $46,700 mark.
Bitcoin price analysis reveals that the king of cryptocurrency is now stable above the $46,000 range but there are high fluctuations of over 500 dollars occurring regularly at the time of writing. Bitcoin price plunged over seven thousand dollars on the 7th of September and the king has been trying to stabilize since then. The big flash crash did not only plunge the king coin into a bearish momentum but also the industry as a whole. At the time of Bitcoin is trading hands for $46,194 with small fluctuations.
Bitcoin price analysis: 1-day chart shows normalizing behavior
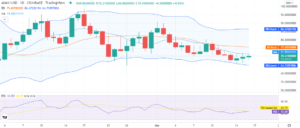
The one-day Bitcoin price analysis shows that the king of cryptocurrency is finally moving into normal routine movements with bearish crossovers that were evident on the chart until yesterday as well. With a definitive increase in volatility, the current volatility is still less than the last month. The upper Bollinger band is found at the $52,079 mark, also showing the strongest resistance at the time of writing. The lower Bollinger band is found below the price at the $45,331 mark showing the strongest resistance point.

The first bearish crossover is at the nine-day moving average that stands at the $49,084 mark above the current price level. Whereas the second bearish crossover is occurring at $48,705 dollars. The relative strength index (RSI) is standing at a neutral score of 46.35 providing ample opportunity for the bullish momentum to take shape.
BTC/USD price chart: 4 hour candlestick chart shows higher volatility
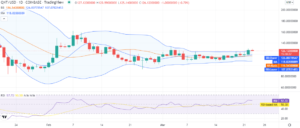
The four-hour Bitcoin price analysis chart shows a higher level of volatility as compared to the one-day chart. The upper Bollinger band is found at $54,476, showing the highest resistance point on the four-hour chart is much higher than the one-day chart. The lower Bollinger band showing the highest support is also found at a lower point than the one-day chart with a value of $43,110 mark.

The first bearish crossover on the four-hour chart is the Bollinger bands’ average found at the $48,793 mark. While the second crossover is at the nine-day moving average at the $46,164 mark. The relative strength index is also qualified to be in the neutral zone but touching the oversold level with a score of 34.45, which provides ample opportunity for the bullish momentum to take shape through buying trends.
Bitcoin price analysis conclusion
The king of cryptocurrency is going through a rough market movement after the big drop while struggling to find a strong base that would allow the king to retest the higher price levels. The increased volatility in the market is not helping the cause for Bitcoin at all, but the price is stabilizing above the $46,000 mark. If the current support levels persist, Bitcoin is likely to take a jab at the $47,000 high. If the current support levels falter due to volatility, the coin is likely to drop down to the $45,000 range.
Disclaimer. The information provided is not trading advice. Cryptopolitan.com holds no liability for any investments made based on the information provided on this page. We strongly recommend independent research and/or consultation with a qualified professional before making any investment decisions.
Source: https://api.follow.it/track-rss-story-click/v3/tHfgumto13AeBBKAObUaHgpx5_w21kha
- 000
- 110
- advice
- All
- analysis
- bearish
- Bearish Momentum
- Bears
- Bitcoin
- Bitcoin Price
- BTC
- Bullish
- Buying
- Cause
- Coin
- Crash
- cryptocurrency
- Cryptopolitan
- Current
- data
- DID
- dollars
- Drop
- Finally
- First
- Flash
- High
- HTTPS
- Increase
- index
- industry
- information
- investment
- Investments
- King
- Level
- liability
- Making
- mark
- Market
- Momentum
- Opportunity
- price
- Price Analysis
- range
- Relative Strength Index (RSI)
- research
- small
- support
- time
- Trading
- Trends
- value
- Volatility
- writing