Bitcoin Price Prediction – May 29
Following the $40,000 break, BTC/USD is now dropping heavily after rejection at $37,348.
BTC/USD Long-term Trend: Bearish (Daily Chart)
Key levels:
Resistance Levels: $44,000, $46,000, $48,000
Support Levels: $27,000, $25,000, $23,000

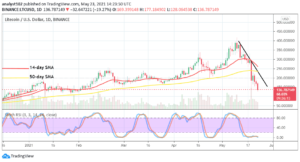
BTC/USD is now showing some signs of weakness after touching the high of $37,348 today. The Bitcoin price continued to fail to make any ground above the resistance. Therefore, it has dropped by a total of 3.52% within the 24 hours of trading as it touches the daily low of $33,850. Looking at the daily chart, we can clearly see the Bitcoin price not able to remain above the 9-day moving average.
Bitcoin Price Prediction: Is Bitcoin Price Ready To Go Lower?
The daily chart reveals to us that Bitcoin (BTC) continues to develop some signs of weakness for the past few days. Therefore, the resistance provided by the 9-day moving average continues to fail each time it attempts to break, and close, above this barrier. However, the market price still remains bearish as the signal line of the Relative Strength Index (14) moves into the oversold region.
On the other hand, the Bitcoin price needs to break the $40,000 resistance to make the market bullish in nature. But, if the sellers push the market price beneath the support at $30,000, the next level of support could lie at $28,000. Wherefore, beneath this, additional supports could be found at $27,000, $25,000, and $23,000 respectively.
Moreover, should in case the bulls regroup and push higher, the first 2 levels of resistance lie at $42,000 and $43,000. Above this, BTC/USD can hit the potential resistance at $44,000, $46,000, and $48,000.
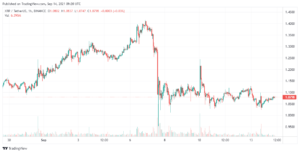
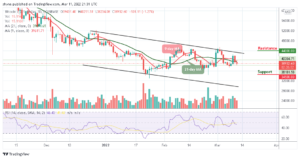
BTC/USD Medium – Term Trend: Ranging (4H Chart)
BTC/USD trades within the range of $33,000 to $40,000. Nevertheless, Bitcoin has not yet slipped below $30,000 and is still in the loop of making a bounce back from where it is currently trading at $34,956 which could take enough time before trading above $40,000. Meanwhile, the upward movement may be facing hurdles near the resistance level of $37,000 and above.
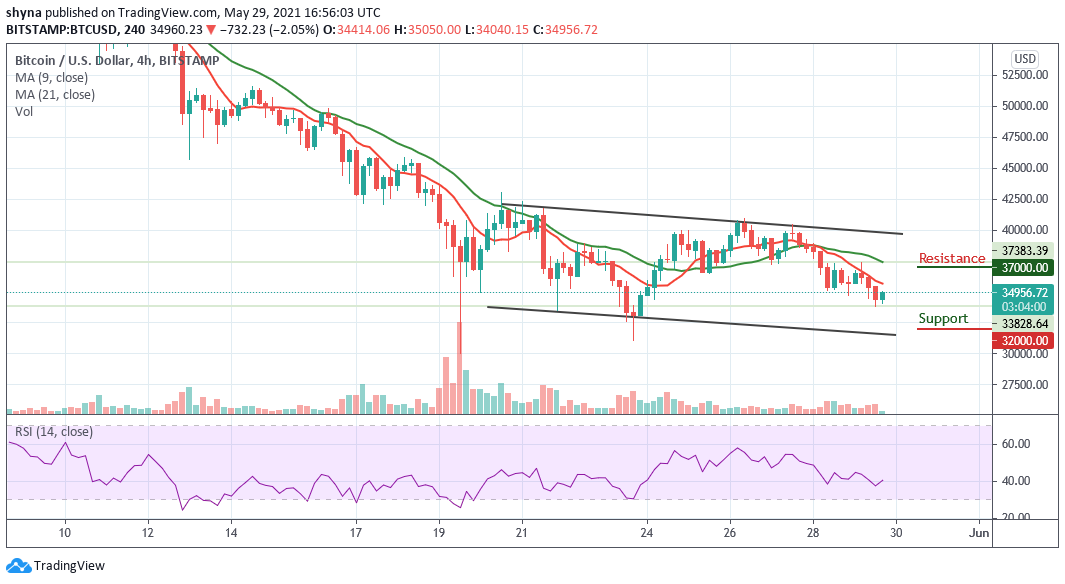
Looking at the downside, immediate support remains around the $34,500 level while the main support is at the $33,000 level. The price might slide sharply below $32,000 which may likely test another support below the lower boundary of the channel Technically, Bitcoin is currently moving in sideways while the Relative Strength Index (14) moves around 40-level.
Looking to buy or trade Bitcoin (BTC) now? Invest at eToro!
75% of retail investor accounts lose money when trading CFDs with this provider
Source: https://insidebitcoins.com/news/bitcoin-price-prediction-btc-usd-dives-below-35000-support
- 000
- Additional
- around
- bearish
- Bitcoin
- Bitcoin Price
- Bitcoin price prediction
- BTC
- BTC/USD
- Bullish
- Bulls
- buy
- continues
- develop
- dropped
- facing
- First
- High
- HTTPS
- Hurdles
- index
- investor
- IT
- Level
- Line
- Making
- Market
- medium
- money
- Near
- Other
- prediction
- price
- Price Prediction
- range
- retail
- Sellers
- Signs
- support
- Supports
- test
- time
- trade
- trades
- Trading
- us
- within