Bitcoin Price Prediction – November 18
At the time of writing, the Bitcoin price loses traction after hitting $57,657; losses likely to continue in the near term.
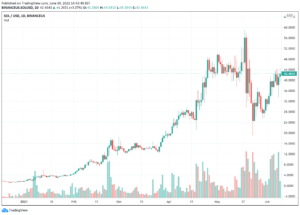
BTC/USD Long-term Trend: Bullish (Daily Chart)
Key levels:
Resistance Levels: $65,000, $67,000, $69,000
Support Levels: $52,000, $50,000, $48,000

Looking at the daily chart, it can be easily seen that the market is back in the red zone as BTC/USD is posting minor losses of 3.53% on the day after commencing the trading at $60,351. It has an intraday high of $60,977; although the world’s largest crypto touches the support level of $58,139 before going back to where it is currently trading at $58,221.
Bitcoin Price Prediction: Bitcoin (BTC) May Touch $55,000 Low
The Bitcoin price is currently moving below $60,000, marking $58,221 as the current daily low at the moment. Does this mean that Bitcoin (BTC) is finally leaving the significant $60,000 level and searching for a new low? Looking at the declining daily volume candle, together with the steady but stable recent Bitcoin price action, it can be assumed that a stronger move may be coming up soon into the market.
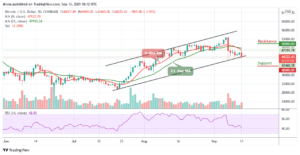
At the time of writing, BTC/USD is struggling to maintain the $60,500 level and if the coin follows the downward trend as the technical indicator Relative Strength Index (14) crosses below 40-level, the next supports may likely come at $52,000, $50,000, and $48,000. On the upside, if the bulls push the price back above the resistance level of $60,000, then further movement could go above the 9-day and 21-day moving averages which could hit the resistance levels of $65,000, $67,000, and $69,000 which will be well above the channel.

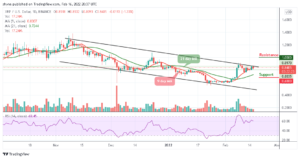
BTC/USD Medium-Term Trend: Bearish (4H Chart)
On the 4-Hour chart, BTC price hovers below the 9-day and 21-day moving averages around $57,009 which may take time to persistently trade above $58,000. In addition, if the bulls gather enough strength and regroup, the upward movement may be able to near the $60,000 and $62,000 resistance level.

However, on the downside, immediate support is around the $56,000 level while the main support is at the $55,000 level. The price may likely fall below $53,000 if the bears step back into the market, a further movement could reach the critical support at $51,000 level. Technically, BTC/USD is still moving in downtrend as the technical indicator Relative Strength Index (14) moves into the oversold region, indicating a bearish movement.
Looking to buy or trade Bitcoin (BTC) now? Invest at eToro!
68% of retail investor accounts lose money when trading CFDs with this provider
Read more:
- "
- 000
- Action
- All
- around
- bearish
- Bears
- Bitcoin
- Bitcoin Price
- Bitcoin price prediction
- BTC
- btc price
- BTC/USD
- Bullish
- Bulls
- buy
- Coin
- coming
- continue
- crypto
- Current
- day
- faces
- Finally
- High
- HTTPS
- index
- investor
- IT
- Level
- Market
- money
- move
- Near
- prediction
- price
- Price Prediction
- retail
- support
- support level
- Supports
- Technical
- time
- touch
- trade
- Trading
- volume
- writing