Bitcoin Price Prediction – September 3
The Bitcoin price is struggling to hold above the $50,000 but overhead selling pressure continues to make this task a difficult one for the bulls.
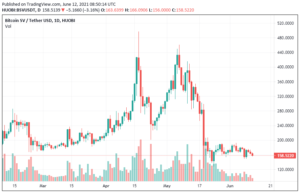
BTC/USD Long-term Trend: Bullish (Daily Chart)
Key levels:
Resistance Levels: $55,000, $57,000, $59,000
Support Levels: $45,000, $43,000, $41,000

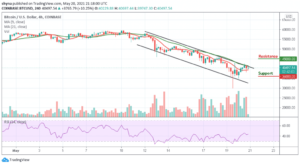
At the time of writing, BTC/USD is seeking support above $49,000 to avoid extending the bearish leg to $46,000. The 9-day moving average is also a key level in the mission to avert the losses, perhaps reverse the trend for gains heading to $50,500. Alternatively, the BTC bulls need to find acceptance above the intraday highs of $51,064 to refuel the recovery momentum.
Bitcoin Price Prediction: Bitcoin Price May Grow Stronger
The Bitcoin price is stable above $50,000 as it is currently attempting to keep the upside above the 9-day and 21-day moving averages. Meanwhile, BTC/USD is slowly moving higher towards the $51,000 resistance level. The next key resistance level may be found at 53,000, above which the bulls are likely to hit the potential resistance at $55,000, $57,000, and $59,000 in the near term.
On the other hand, if there is no clear break above $51,000, there are chances of a fresh decline. However, if the 9-day MA crosses below the 21-day MA, the coin may stay enter into the negative side and initial support is near the $47,000 level. The main support could then form near the $46,000 support which could cause the king coin to dive towards the supports of $45,000, $43,000, and $41,000 as the technical indicator Relative Strength Index (14) remains above the 60-level.
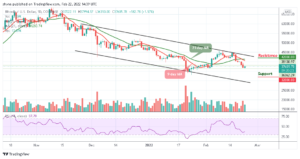
BTC/USD Medium – Term Trend: Ranging (4H Chart)
On the 4-hour chart, a retest of $50,200 gives the impression that the bulls are not yet done. The Bitcoin price rises to fill a significant gap as the bulls remained in control which may take the coin towards the $51,000. In a short time, BTC/USD may hit $51,500 if the bullish pressure continues. Otherwise, the price may revisit the supports of $49,000 and below.

On the upside, a bullish move may hit the resistance at $51,500 and above. As of now, the Relative Strength Index (14) is moving below 65-level, this could mean that the BTC/USD trading is looking for another close support. Meanwhile, a significant cross below the 9-day moving average may send the market in a bearish scenario.
Looking to buy or trade Bitcoin (BTC) now? Invest at eToro!
75% of retail investor accounts lose money when trading CFDs with this provider
Source: https://insidebitcoins.com/news/bitcoin-price-prediction-btc-usd-holds-price-above-50000
- 000
- bearish
- Bitcoin
- Bitcoin BTC
- Bitcoin Price
- Bitcoin price prediction
- BTC
- BTC/USD
- Bullish
- Bulls
- buy
- Cause
- chances
- Coin
- continues
- form
- fresh
- gap
- Grow
- hold
- HTTPS
- index
- investor
- IT
- Key
- King
- Level
- Market
- medium
- Mission
- Momentum
- money
- move
- Near
- Other
- prediction
- pressure
- price
- Price Prediction
- recovery
- retail
- reverse
- seeking
- Short
- stay
- support
- Supports
- Technical
- time
- trade
- Trading
- writing