Bitcoin Price Prediction – August 25
The Bitcoin price is moving against the USD at numerous levels which are finding their way towards the resistance level of $50,000.
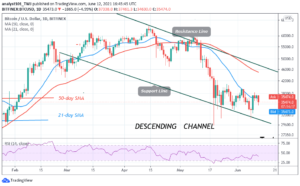
BTC/USD Long-term Trend: Ranging (Daily Chart)
Key levels:
Resistance Levels: $53,000, $55,000, $57,000
Support Levels: $43,000, $41,000, $39,000
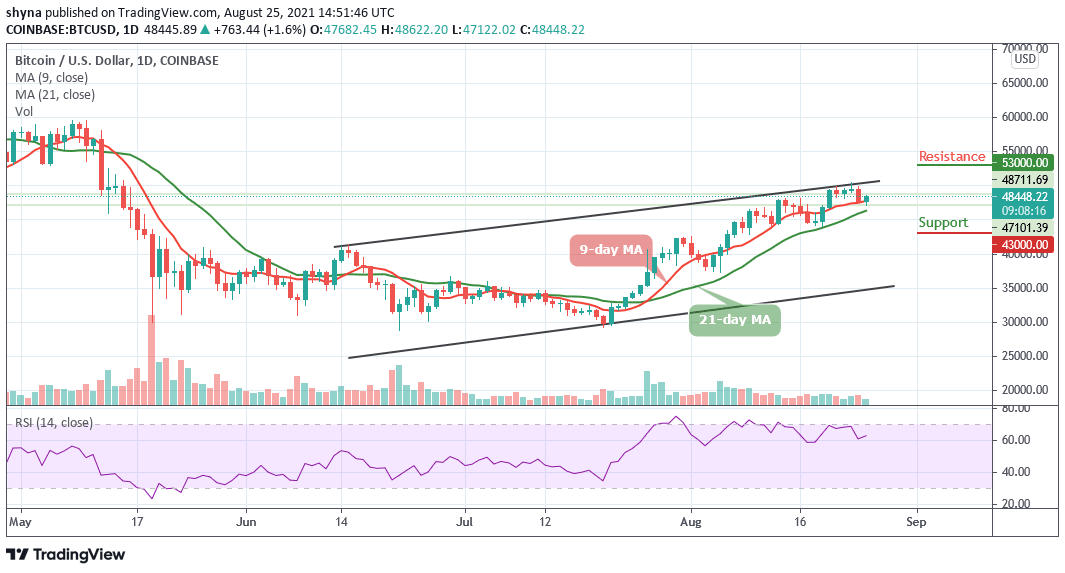
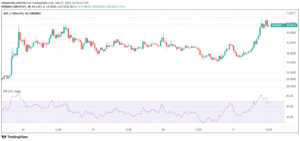
BTC/USD is resuming its upward movement after a brief dip yesterday taking the price from $47,682 to $48,622. A couple of days ago, BTC/USD hit just over $50,500 before retreating to a local low of around $47,600 yesterday. However, the Bitcoin price is now heading towards the north as it is trading above the 9-day and 21-day moving averages.
Bitcoin Price Prediction: Bitcoin Bulls May Regain Strength
The Bitcoin price is currently hovering above the 9-day moving average which could function as the support zone in the event a reversal occurs. However, as the Bitcoin price moves and prepares to break above the upper boundary of the channel, little is in place to prevent correction targeting the key resistance of $51,000 as the technical indicator Relative Strength Index (14) moves above the 60-level.
Moreover, BTC/USD is banking on the support at $45,000 to ensure that in spite of a reversal, the Bitcoin price stays above the $47,500 level. Similarly, if the king coin continues with the upward movement, it may likely hit the nearest resistance levels at $53,000, $55,000, and $57,000 while crossing below the 21-day moving average may lead it to the support levels of $43,000, $41,000, and $39,000 respectively.
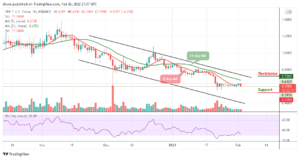
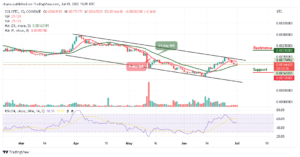
BTC/USD Medium – Term Trend: Bullish (4H Chart)
The 4-hour chart shows that the price is on its way up as the technical indicator Relative Strength Index (14) is seen moving above 45-level to confirm the uptrend. Although bears have been keeping the downward movement for some time now, the market may begin to experience a bullish movement if the price crosses above the 9-day and 21-day moving averages.
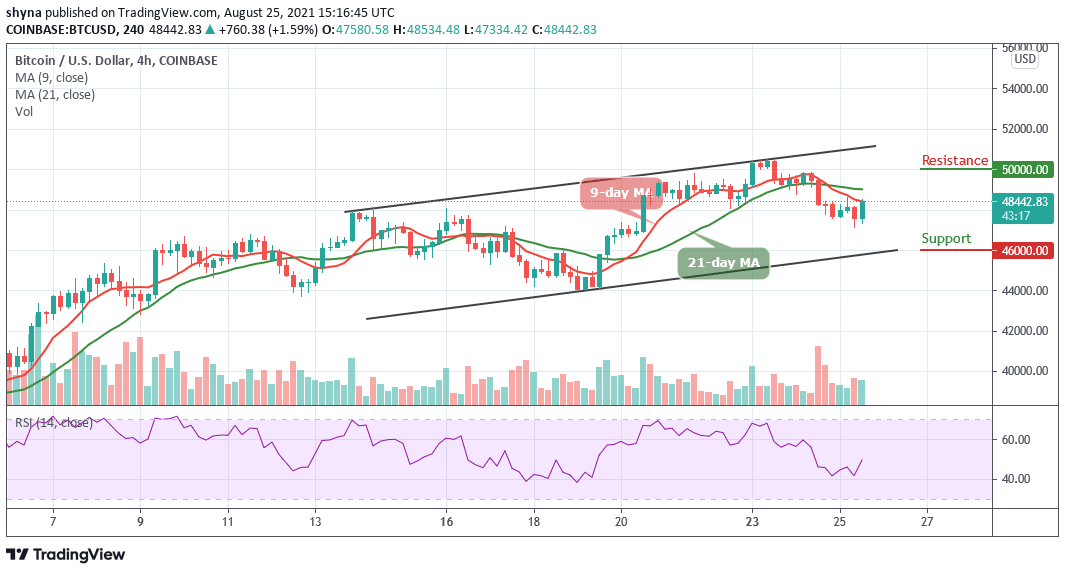
On the contrary, the support level of $46,000 and below may come into play if the price remains at the downside and move towards the lower boundary of the channel. But if the buyers can gather enough strength and power the market; they can push the price towards the upper boundary of the channel where it could hit the targeted resistance level of $50,000 and above.
Looking to buy or trade Bitcoin (BTC) now? Invest at eToro!
75% of retail investor accounts lose money when trading CFDs with this provider
Source: https://insidebitcoins.com/news/bitcoin-price-prediction-btc-usd-moves-close-to-49000-level
- 000
- around
- AUGUST
- Banking
- Bears
- Bitcoin
- Bitcoin BTC
- Bitcoin Price
- Bitcoin price prediction
- BTC
- BTC/USD
- Bullish
- Bulls
- buy
- Coin
- continues
- Couple
- Event
- experience
- function
- HTTPS
- index
- investor
- IT
- keeping
- Key
- King
- lead
- Level
- local
- Market
- medium
- money
- move
- moves
- North
- power
- prediction
- price
- Price Prediction
- retail
- support
- support level
- Technical
- time
- trade
- Trading
- USD