Bitcoin Price Prediction – January 31
The Bitcoin price prediction is seen moving above $38,000 as the recovery is coming up slowly towards the north.
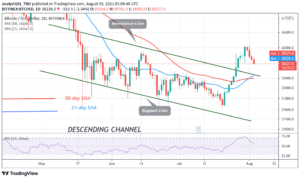
BTC/USD Long-term Trend: Bearish (Daily Chart)
Key levels:
Resistance Levels: $43,500, $45,500, $47,500
Support Levels: $33,500, $31,500, $29,500

BTC/USD price movement on the daily chart is reflecting an improvement. If the same remains locked, then the expectation of quick recovery could turn out to be true. Now, BTC/USD is seen trading at $38,504 after soaring to $58,785. The coin is also seen pulling back to where it is trading currently and could head downwards if the bears hijacked the price movement.
Bitcoin Price Prediction: What is the Next Direction for Bitcoin?
It is important for Bitcoin price to hold the 9-day moving average within the channel and confirm it otherwise there can come a bearish breakdown if BTCUSD falls below that barrier. The technical indicator Relative Strength Index (14) is sending moderate signs where an oscillation to the higher boundary may confirm the proper trend which is more likely a bullish trend at the time of the outcome.
However, BTC/USD will confirm the bullish trend if the market price moves above the 21-day moving average else it may follow the bearish trend if the price moves below the 9-day moving average. Meanwhile, a strong bullish spike above $40,000 may likely take the price to the resistance levels of $43,500, $45,500, and $47,500.

Nevertheless, if the market decides to follow the downward trend, BTC/USD could fall below the channel and may hit the nearest support at $35,000, and should this support fails to contain sell-off, the market may experience another drop to the critical supports of $33,500, $31,500, and $29,500.
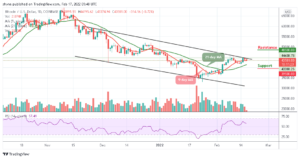
BTC/USD Medium-Term Trend: Ranging (4H Chart)
According to the 4-hour chart, we have seen the upward movement which is quite notable on the structural outlook. BTC/USD trading is steady above $38,000 as the crypto asset moves to hit the $39,000 resistance level. From above, further bullish movement may likely meet the potential resistance at around the $40,000 and above.
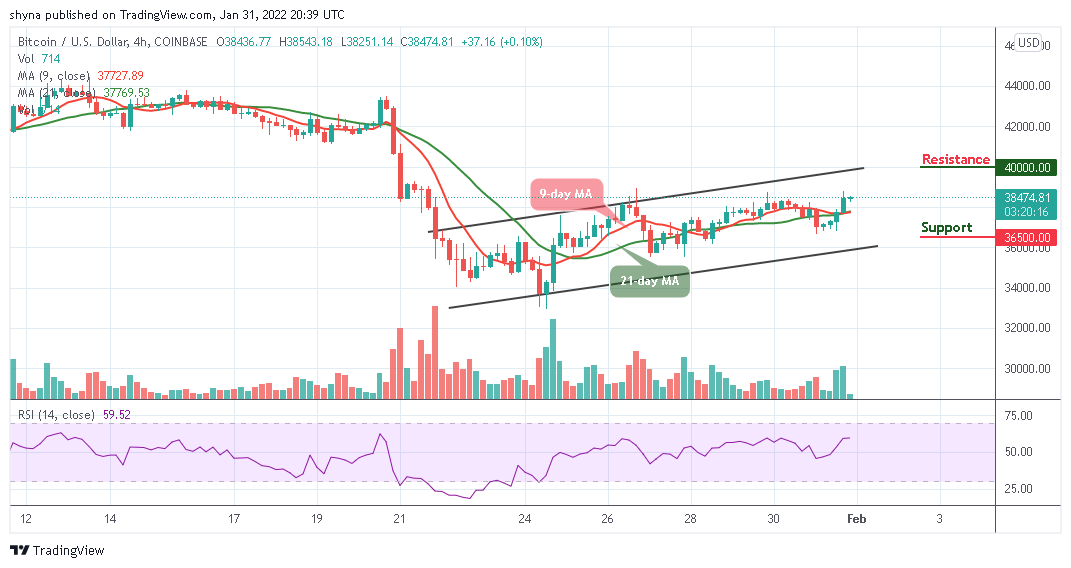
As of now, the technical indicator Relative Strength Index (14) is reflected in the positive zone, moving above the 60-level. A significant cross below this level may send the market in a bearish scenario and the nearest supports lie at $36,500 and below.
Looking to buy or trade Bitcoin (BTC) now? Invest at eToro!
68% of retail investor accounts lose money when trading CFDs with this provider
Read more:
- 000
- around
- asset
- average
- bearish
- Bears
- Bitcoin
- Bitcoin Price
- Bitcoin price prediction
- BTC
- BTC/USD
- BTCUSD
- Bullish
- buy
- Coin
- coming
- could
- crypto
- crypto asset
- Drop
- experience
- follow
- head
- hold
- HTTPS
- important
- index
- investor
- IT
- January
- Level
- locked
- Market
- money
- movement
- North
- otherwise
- Outlook
- prediction
- price
- Price Prediction
- pulling
- ranging
- recovery
- retail
- significant
- Signs
- strong
- support
- Supports
- Technical
- time
- trade
- Trading
- What
- What is
- within