Bitcoin Price Prediction – August 11
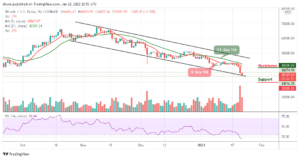
The Bitcoin price prediction shows BTC bounces off the support at $45,350 as the coin moves close to the resistance level of $50,000.
BTC/USD Long-term Trend: Bullish (Daily Chart)
Key levels:
Resistance Levels: $51,000, $53,000, $55,000
Support Levels: $42,000, $40,000, $38,000

BTC/USD is currently trading around $46,146 with a 1.21% gain since the European session. According to the daily chart, the Bitcoin price is fighting to stay above the important level of $45,000 as it moves to cross above the upper boundary of the channel. However, for BTC/USD to remain at this level for the next few days, the bulls need to make the $44,000 support level to be pretty strong.
Bitcoin Price Prediction: Bitcoin (BTC) Could Spike Higher
At the time of writing, the Bitcoin price continues to follow the upward movement, and if the first digital asset breaks above the upper boundary of the channel, it could touch the nearest resistance level of $48,000. Moreover, Bitcoin (BTC) needs to claim this important resistance level to head upwards. If successful, the number one crypto could therefore aim at $48,000, which could be followed by $49,000, and $50,000 levels.
However, looking at the Relative Strength Index (14), the signal line is still hovering within the overbought region and one may conclude that BTC/USD is done with the downside. More so, on the upside, recovery may not come easy and traders must be aware that support will have to be sort above $45,000 while other important zones to keep in mind are around $51,000, $53,000, and $55,000 resistance levels.
Nevertheless, despite the current movement, the RSI (14) is likely to leave the overbought zone which means that there may still be a room that could be explored by the bears. If this happens, the supports at $42,000, $40,000, and $38,000 may likely come to focus.
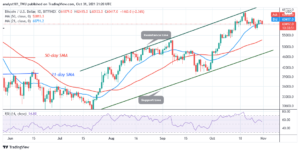
BTC/USD Medium – Term Trend: Ranging (4H Chart)
From a technical point of view, on the 4-hour chart, the technical indicator Relative Strength Index (14) now moving sideways and may likely cross below 60-level to begin a downward movement. However, there is a little bit of bullish divergence on the technical indicator as the signal line could still face the north.

Nevertheless, if the Bitcoin price breaks above the upper boundary of the channel, the market price could reach the resistance at $48,000 and above. On the contrary, if the current market value drops below the 9-day and 21-day moving averages, it may likely touch the support at $44,000 and below.
Looking to buy or trade Bitcoin (BTC) now? Invest at eToro!
75% of retail investor accounts lose money when trading CFDs with this provider
Source: https://insidebitcoins.com/news/bitcoin-price-prediction-btc-usd-ready-to-hit-50000
- 000
- around
- asset
- AUGUST
- Bears
- Bit
- Bitcoin
- Bitcoin Price
- Bitcoin price prediction
- BTC
- BTC/USD
- Bullish
- Bulls
- buy
- Coin
- continues
- crypto
- Current
- digital
- Digital Asset
- European
- Face
- First
- Focus
- follow
- head
- HTTPS
- index
- investor
- IT
- Level
- Line
- Market
- medium
- money
- North
- Other
- Point of View
- prediction
- price
- Price Prediction
- recovery
- retail
- So
- stay
- successful
- support
- support level
- Supports
- Technical
- time
- touch
- trade
- Traders
- Trading
- value
- View
- within
- writing