Bitcoin continues to observe new yearly lows for volume as volatility also continues to decline further.
Bitcoin Volume And Volatility At Yearly Lows
As per an Arcane Research report, the 7-day average trading volume for BTC continues to hit yearly lows. This is the third consecutive week that the indicator has plunged down.
The below chart shows how the value of this Bitcoin metric has changed in the past one year.

BTC trading volume continues the downtrend
Last week the BTC trading volume hit the lowest of the year with $2.2 billion in volume. This week continues the trend of lows as the value of the indicator floats around $3 billion.
While the value is slightly higher than last week, it’s still lower than anything seen in the first half of 2021. To be exact, this kind of trading volume hasn’t been seen since the bull run started.
An interesting feature of the Bitcoin 7-day average daily volume graph is that the summer of 2020 saw very low trading volumes. It’s looking likely that the season this year will also follow a similar trend.
Related Reading | Reports Show China Lost Bitcoin Hash Power Before Conducting The Crackdown
Not just the trading volume, but also the BTC volatility seems to have taken a hit. Here is a chart showing the trend in the value of this indicator:

The BTC-USD Volatility indicator declines further
As the graph shows, the BTC volatility seems to be continuing its downwards trend. The 7-day average has now reached 1.68%, a new yearly low.
The last time the 7-day average trading volume observed such a low value was in October of last year. As the graph shows, the value reached these levels throughout the summer of 2020. This could be another indicator that this season will go like the last, where the Bitcoin market has no appetite for trading.
BTC Price
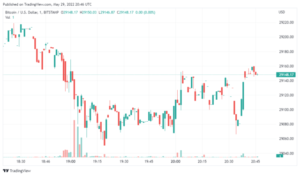
At the time of writing, Bitcoin’s price seems to be around $29.5k, down 9% in the last 7 days. Over the past month, the crypto has shed almost 13% in value.
Here is a chart showing the trend in the price of the coin over the past 6 months:

Bitcoin continues the downtrend | Source: BTCUSD on TradingView
BTC has finally broken out of the $30k-$35k levels after being in a range bound market for a few weeks now. As the trading volume and volatility parameters suggest, investors haven’t moved their assets much during this boring period of stagnation.
Related Reading | Here Is Why The Russian Crypto Industry Is Trying To Attract Bitcoin Miners
Since Bitcoin is now out of the range, it’s looking likely that market activity could once again start. However, as for the where the price will head next, it’s a bit hard to say right now.
Featured image from pexels.com, charts from Arcane Research, tradingview.com
- 2020
- 2021
- 7
- appetite
- around
- Assets
- Billion
- Bit
- Bitcoin
- Bitcoin Price
- bitcoin trading
- Bitcoin volatility
- BTC
- btc trading
- BTCUSD
- Bull Run
- Charts
- China
- Coin
- continues
- crypto
- Crypto Industry
- Feature
- Finally
- First
- follow
- hash
- hash power
- head
- here
- How
- HTTPS
- image
- industry
- Investors
- Market
- months
- power
- price
- range
- Reading
- report
- research
- Run
- start
- started
- summer
- The Graph
- time
- Trading
- value
- Volatility
- volume
- week
- writing
- year