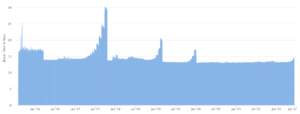
A leading indicator of recessions is flashing red at record levels according to data by the St Louis branch of the Federal Reserve Banks.
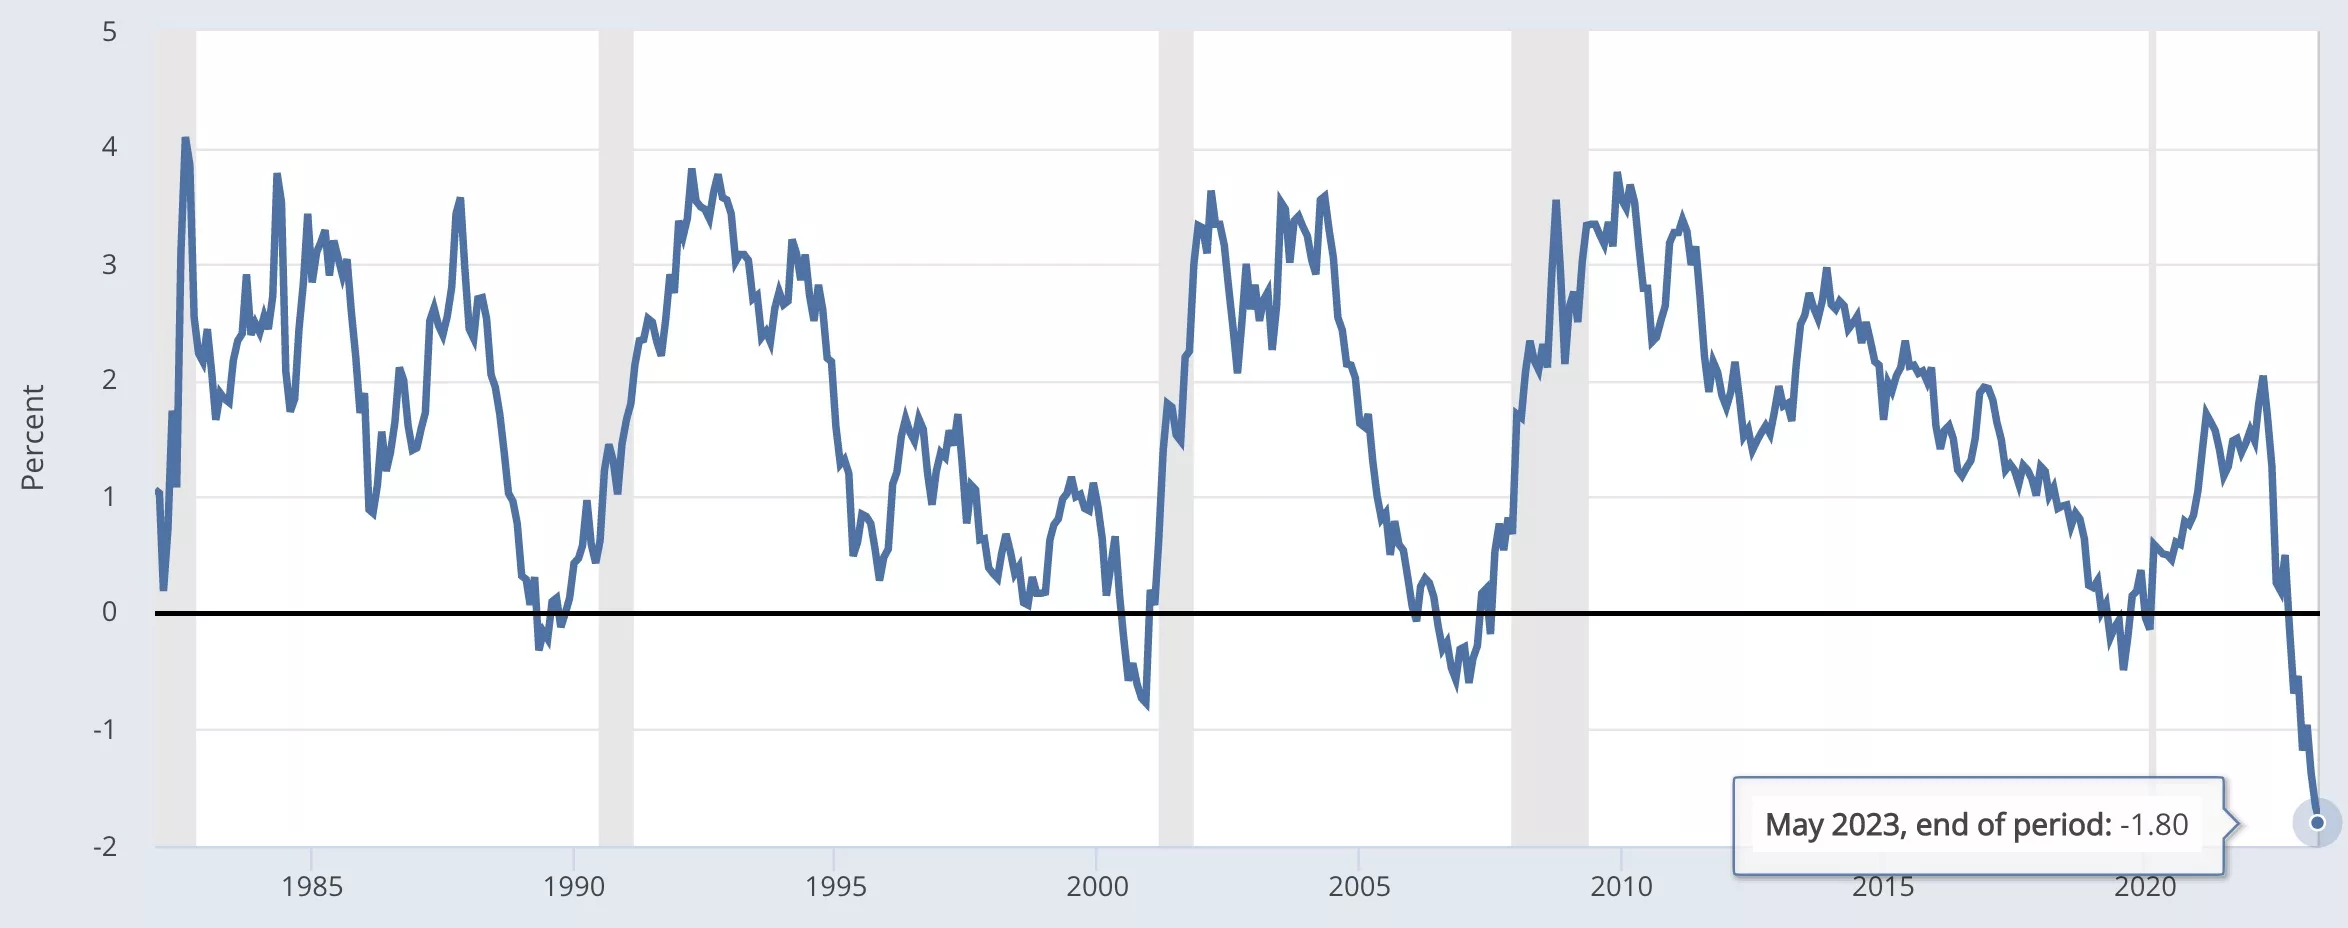
For the first time since records began, the spread between three month treasuries and 10 year treasuries has dive to -1.80%.
That is, the market demands a far higher interest rate to lend to the government for three months than for ten years, when naturally holding for three months is far less riskier than for ten years.
Yet the market currently demands the government pays an eye-watering 5.27% for three month bonds, and 3.59% for ten year debt.
The reason for the three month rate is simple. The base rate at the central bank is 5%, and everyone expects it to be increased to 5.25% later today. So the ‘market’ is asking the government to pay what the central bank is demanding, circa 5.25%.
The reason for the ten year bond rate however is more complicated. It should be higher, certainly higher than the base rate at the central bank, because a lot can happen in ten years. Yet the market demands 3.6%.
Why? Well economists since the 80s have argued the inversion suggests the market expects spot rates to fall, and they expect those rates to fall because they expect the GDP growth rate to fall.
In other words, although the central bank base rate will be 5.25% in a few hours, the market expects it to fall by about 2% soon-ish, and so they’re asking the government to pay that lower rate of 3.6% for the ten year term.
A Steep Recession?
As seen in the featured image above, it is striking how predictive of recessions this indicator has been for four decades.
It flattens, and then usually slightly falls into the negative months before a recession, to then go back to normal levels where short term bonds have a lower rate than ten year terms.
This time however it has not just fallen slightly into negative territory, but to incredible levels historically.
The closest to it is December 2000 when the spread fell to -0.77%. Four months later, a recession was declared in April which lasted until November.
Curiously, the spread always seems to rise from the bottom before a recession with no exceptions so far. That is the central bank foresees a recession is coming, so it lowers the rate, and then there’s a recession.
Central banks in Europe and US have been saying for months that the economic outlook is to the downside. Germany has now become the first major economy to see a contraction in Q1, so the ‘downside’ is moving towards an actual recession.
Yet rather than pausing hikes or cutting rates, the Federal Reserve will raise them again today, even though 60% of analysts think they should have stopped raising last month.
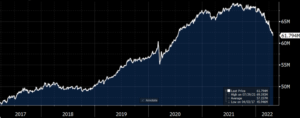
The big question therefore is: is the depth of this spread predicting not just a recession, but a record breaking hard landing?
Looking at the chart above, there does not visually appear to be a good relationship between how much the spread fell into the negative, and for how long the recession lasted, but they all previously fell to around the same level.
This is the first time they are close to breaching -2%, suggesting the market thinks the economy will get so bad, Fed will have to steeply cut.
Or it could well be they think inflation will fall so significantly that Fed will cut steeply, with the one year bond rate standing at 4.74%, below the current base rate, while 3 year rates are at 3.75%.
All of these are far higher than over the past 15 years, but if it was a temporary inflation matter, in the 80s when inflation was far higher, the spread did not even go into the negative.
That may perhaps suggest Fed has done a good job at setting inflation expectations, and so the market is not demanding even the base rate for ten year bonds, lending instead to the government at a lower rate than it costs them to get money from the Fed.
That’s unsustainable, and the only reason it is happening is because the market is sure the base rate will fall steeply because inflation will come down and inflation will come down if the economy slows and so the hard landing scenario is now firmly in the picture considering the steepness of this indicator.
- SEO Powered Content & PR Distribution. Get Amplified Today.
- PlatoAiStream. Web3 Data Intelligence. Knowledge Amplified. Access Here.
- Minting the Future w Adryenn Ashley. Access Here.
- Source: https://www.trustnodes.com/2023/05/03/bond-spreads-break-record
- :has
- :is
- :not
- :where
- 10
- 15 years
- 2%
- a
- About
- above
- According
- again
- All
- Although
- always
- an
- Analysts
- and
- appear
- April
- ARE
- around
- At
- back
- Bad
- Bank
- Banks
- base
- BE
- because
- become
- been
- before
- began
- below
- between
- Big
- bond
- Bonds
- Bottom
- Branch
- Break
- Breaking
- but
- by
- CAN
- central
- Central Bank
- certainly
- Chart
- Close
- come
- coming
- complicated
- considering
- Costs
- could
- Current
- Currently
- Cut
- cutting
- data
- Debt
- decades
- December
- demanding
- demands
- depth
- DID
- does
- done
- down
- downside
- Economic
- economists
- economy
- Europe
- Even
- everyone
- expect
- expectations
- expects
- Fall
- Fallen
- Falls
- far
- featured
- Fed
- Federal
- federal reserve
- few
- firmly
- First
- first time
- flashing
- For
- four
- from
- GDP
- gdp growth
- Germany
- get
- Go
- good
- good job
- Government
- Growth
- happen
- Happening
- Hard
- Have
- higher
- Hikes
- historically
- holding
- HOURS
- How
- However
- HTTPS
- if
- image
- in
- increased
- incredible
- Indicator
- inflation
- Inflation expectations
- instead
- interest
- INTEREST RATE
- into
- inversion
- IT
- Job
- just
- landing
- Last
- later
- leading
- LEND
- lending
- less
- Level
- levels
- Long
- Lot
- Louis
- major
- Market
- Matter
- May..
- money
- Month
- months
- more
- moving
- much
- naturally
- negative
- negative territory
- no
- normal
- November
- now
- of
- ONE
- only
- or
- Other
- Outlook
- over
- past
- Pay
- pays
- perhaps
- picture
- plato
- Plato Data Intelligence
- PlatoData
- predicting
- previously
- question
- raise
- raising
- Rate
- Rates
- rather
- reason
- recession
- record
- records
- Red
- relationship
- Reserve
- Rise
- same
- saying
- scenario
- see
- seems
- seen
- setting
- Short
- should
- significantly
- Simple
- since
- slows
- So
- so Far
- Spot
- spread
- Spreads
- stopped
- suggest
- Suggests
- sure
- temporary
- ten
- term
- terms
- territory
- than
- that
- The
- the Fed
- Them
- then
- There.
- therefore
- These
- they
- Think
- Thinks
- this
- those
- though?
- three
- time
- to
- today
- towards
- Treasuries
- Trustnodes
- unsustainable
- us
- usually
- was
- webp
- WELL
- What
- when
- which
- while
- will
- with
- words
- year
- years
- yet
- zephyrnet