After tumbling 76% from its all-time high, Cardano found support at the bottom of the descending channel around $0.75 and was able to reclaim almost 50%. In a few weeks, ADA returned above the converted mark at $1.
The Daily Chart
Technical analysis by Grizzly
On the daily timeframe, after a significant price surge, ADA reached the top of the descending channel as shown on the chart below (marked by yellow), which intersects with the static resistance at $1.2 (marked by blue).
However, the bulls failed in their first attempt to overcome this resistance.
Looking at the RSI 30-day, the downtrend line (marked red) that accompanied Cardano for more than a year has prevented further increase.
By crossing the mentioned resistances and forming a higher high above $1.2 and breaking above the descending channel, the speculators would be more confident in the reversal of the recent downtrend.
On the other hand, if ADA fails at $1.2, then $1 should be a significant support line to watch.
Moving Average Exponential (EMA) lines for possible support/resistance to watch:
EMA20: $0.91
EMA50: $0.95
EMA100: $1.09
EMA200: $1.53

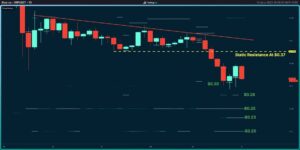
The 4-Hour Chart: Cup and Handle?
On the 4-hour timeframe, Cardano was able to break above the descending trendline (marked by white) that acted as both support and resistance.
As mentioned above, $1.2 got rejected. As of now, Cardano has the potential to form a Cup & Handle pattern, which is a bullish pattern. If the handle is created inside a triangle (marked by yellow) and the price can cross the mentioned resistance, targets above $1.5 seem to be likely.
Short-term Support Levels: $1.7 & $1
Short-term Resistance Levels: $1.2 & $1.35