Cardano price analysis continues to show a bearish outlook today, as price remained stuck in a prolonged horizontal trend around the $0.53 mark. Since the 12 percent decline on May 18, 2022, ADA has failed to move past the $0.55 mark which has become the pinnacle of the continued bearish trend. Over the past 24 hours, ADA price remained fixed within the sideways range, lowering down to $0.50 while moving as high as $0.53. Trading volume fell more than 25 percent, which further solidifies the bearish outlook and poses an inevitability on a revisit to the $0.35 support before buyers come into the market again.
The larger cryptocurrency market showed mixed signals, combined with minor decrements and slight upward progressions. Bitcoin moved back into touching distance of the $30,000 mark with a minor uptrend, following Ethereum’s upward movement to come into proximity of the $2,000 figure. Among major Altcoins, Ripple and Dogecoin consolidated up to $0.40 and $0.08, respectively. Meanwhile, Solana and Polkadot endured slight decrements to move down to $48.62 and $9.92, respectively.

Cardano price analysis: Horizontal trend extends on daily price chart
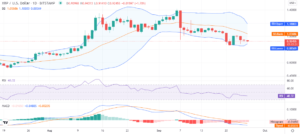
On the 24-hour candlestick chart for Cardano price analysis, price can be seen extending along a bearish rectangular pattern that first emerged on May 19, 2022. Price has since faced multiple rejections around the $0.55 mark and failed to conjure up meaningful momentum upwards. The trend looks set to continue according to major technical indicators on the 24-hour price action, as price remains below the crucial 50-day exponential moving average (EMA) at $0.53.

The 24-hour relative strength index (RSI) shows declining market valuation within the oversold region at 36.26 and has been stagnating over the past 3 days. The 26 percent drop in trading volume over the past 24 hours also translates into the persistent bearish pattern and declining market valuation for ADA which could further drop over the coming trading sessions. In addition, the moving average convergence divergence (MACD) curve is forming higher lows and could diverge below the neutral zone over the next 24-48 hours.
With these bearish indicators, a move down towards support at $0.35 seems likely before a meaningful uptrend is constituted. Conversely, a breakout past the $0.55 cap could bring the $0.61 resistance into play and invalidate the bearish sentiment.
Disclaimer. The information provided is not trading advice. Cryptopolitan.com holds no liability for any investments made based on the information provided on this page. We strongly recommend independent research and/or consultation with a qualified professional before making any investment decisions.
- 000
- 10
- 11
- 2022
- According
- Action
- ADA
- addition
- advice
- Altcoins
- among
- analysis
- around
- average
- bearish
- become
- before
- below
- breakout
- bring
- buyers
- Cardano
- cardano price
- combined
- come
- coming
- continue
- continues
- could
- crucial
- cryptocurrency
- cryptocurrency market
- curve
- decisions
- distance
- down
- Drop
- EMA
- faced
- Figure
- First
- fixed
- following
- further
- High
- higher
- holds
- Horizontal
- HTTPS
- index
- information
- investment
- Investments
- larger
- liability
- likely
- made
- major
- Making
- map
- mark
- Market
- mixed
- Momentum
- more
- move
- movement
- moving
- multiple
- Outlook
- Pattern
- percent
- Play
- Polkadot
- price
- Price Analysis
- professional
- qualified
- range
- recommend
- remained
- research
- return
- sentiment
- sessions
- set
- since
- Solana
- strength
- support
- Technical
- today
- towards
- Trading
- upwards
- Valuation
- volume
- while
- within