After three weeks of a strong uptrend, Ethereum lost almost 10% of its market cap in a few days, dropping from a high at $3547 at the beginning of the week to $3143. The US stock market is also retracing after a 20-day uptrend. In this analysis, we will examine where the key levels.
Technical Analysis
By: Grizzly
The Daily Chart:

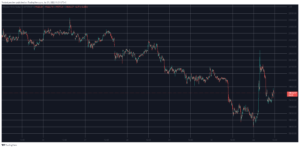
On the daily timeframe, the bulls retreated after failing to break the resistance at $3600, and the bears were able to push the price down to $3143. ETH is currently struggling with the daily MA20 that lies at $3224, and it would be very promising if the bulls can close the candle above it.
The important concern right now is that many participants are worried about further price declines. The daily MA50 and MA100 lie at $2900-$3000 as the support zone seem to be strong, and if the bears push the price below it, the recent uptrend would likely be considered over, and we might have to prepare for the lower levels. On the contrary, the bulls have to break the MA200 and the static resistance at $3600 to form a new uptrend, which could push prices even above $4,000.
The RSI 30d indicator is still in the bullish area and is moving above the ascending line (marked by purple).
The 4-Hour Chart:

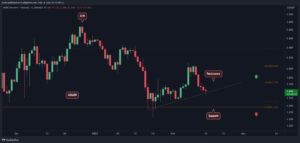
On the 4-hour timeframe, the divergence formed below the resistance key level mentioned in the April 5 analysis caused the price to correct, and Ethereum fell below the MA100 (marked by blue). The bad news is that ETH is forming a lower low, which is technically the beginning of a downtrend.
To avoid this, bulls need to push the price above $3257.
On-chain Analysis
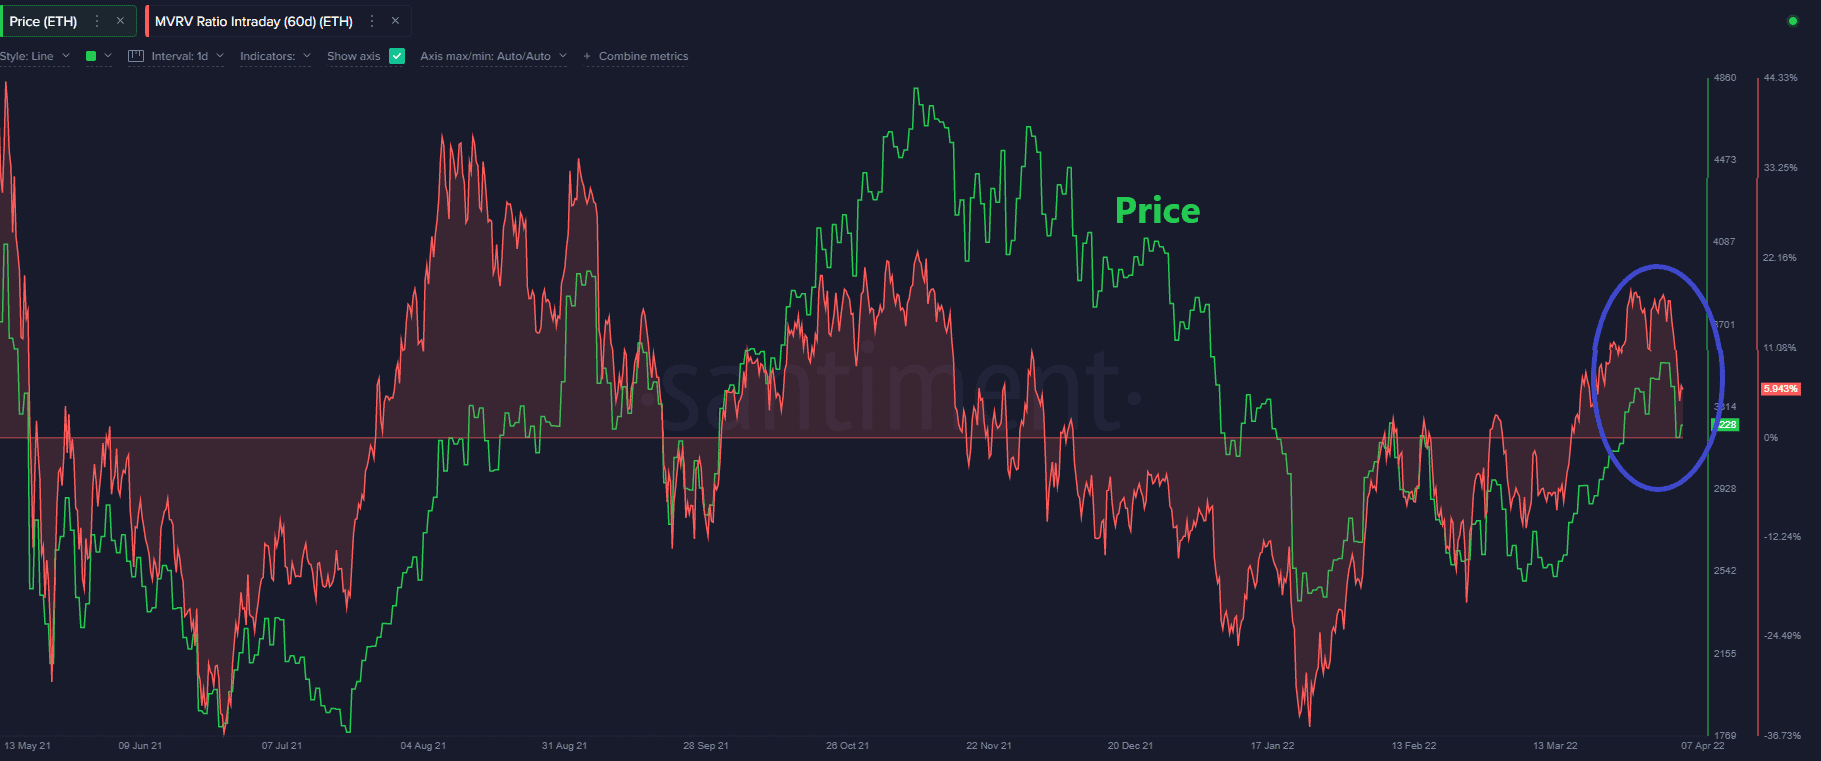
MVRV shows the average profit/loss of all the coins currently in circulation given the current price. MVRV 60d is computed on the coins/tokens that moved at least once in the past 60 days.
The MVRV 60d was able to move above the baseline with good momentum (that was the first time after recording an all-time high) and has now changed direction. Of course, this is not worrying yet, and as long as this metric is above the baseline, one can hope that the uptrend will continue. But it breaks down the baseline, this might put a halt to bullish hopes.
At present, it seems that holding technical supports is more important and has a greater psychological impact.
- $3
- 000
- About
- addresses
- All
- analysis
- April
- AREA
- average
- Baseline
- Bears
- Beginning
- Bullish
- Bulls
- caused
- Coins
- continue
- could
- Current
- down
- ETH
- eth price
- ethereum
- First
- first time
- form
- further
- good
- greater
- High
- holding
- HTTPS
- Impact
- important
- IT
- Key
- Level
- likely
- Line
- Long
- Market
- Market Cap
- Momentum
- more
- move
- moving
- news
- participants
- Play
- present
- price
- Price Analysis
- promising
- stock
- stock market
- strong
- support
- Supports
- Technical
- time
- timeframe
- us
- week
- weekly
- would