TL;DR Breakdown
- Ethereum price analysis reveals that ETH is ready to retest $3,300 high.
- Current support is found at the $3,225 mark.
- Current resistance is found at the $3,275 mark.
Ethereum price analysis reveals that the queen of cryptocurrency is going in to retest the $3,300 high while the king Bitcoin is readying up to test the $50,000 mark. In the past 24-hours alone, the queen has been up by 0.35 percent and 0.43 percent in the past seven days. The queen is closely following the king’s movement for the past few days, as observed earlier as well. At the time of writing, Ethereum is trading hands for $3,271.77 while the price is fluctuating between the $3,269 and $3,272 marks.
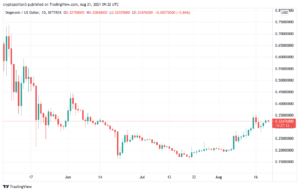
ETH/USD 1-day candlestick price chart reveals bullish momentum
The one-day Ethereum price analysis reveals that the cryptocurrency is following Bitcoin into bullish momentum. The upper Bollinger band is found at the $3,390 mark serving as the strongest resistance. Whereas the lower Bollinger band is at the $3,007 mark, serving as the strongest support level.

The nine-day moving average (SMA 9) is found at the $3,230 mark, also serving as a strong support point along with the Bollinger bands’ average found at the $3,198 mark. The relative strength index (RSI) is found at the 59.09 mark, way below the overbought zone. This RSI score is providing ample opportunity to the bulls to take control of the queen of cryptocurrency and break past the $3,300 psychological barrier.
Ethereum price analysis: 4-hour chart confirms the bullish momentum
The four-hour Ethereum price analysis candlestick chart further confirms that the cryptocurrency is likely to stay in the bullish momentum to retest the $3,300 mark. The volatility is slightly increased as compared to the daily chart. The upper Bollinger band is found at the $3,320 mark, where it serves as the strongest resistance mark.

The lower Bollinger band is standing at the $3,185 mark, posing as the strongest support mark for the cryptocurrency. Another supporting point is found at the nine-day moving average (SMA 9) found at the $3,245 mark. The RSI score is, however, found at the 58.46 mark, slightly lower than the one-day chart but creating ample opportunity for the bulls to take shape and push the cryptocurrency above the $3,300 high.
Ethereum price analysis conclusion
The queen of cryptocurrency, as it is evident from the name, keeps on moving in various directions but stays largely under-shadowed by the king of cryptocurrency, Bitcoin. The current bullish momentum is no different than the usual BTC and ETH relationship. If the current support levels persist, the queen is likely to retest the $3,300 and, further above that, the $3,400 and $3,500 marks.
On the other hand, if the market turns bearish once again, Ethereum is likely to lose the current support levels and dip down below the $3,000 psychological barrier. At the time of writing, what matters more than the Ethereum price action is the overall market momentum which is currently going bullish. If the current trends prevail, there is no stopping the queen of cryptocurrency.
Disclaimer. The information provided is not trading advice. Cryptopolitan.com holds no liability for any investments made based on the information provided on this page. We strongly recommend independent research and/or consultation with a qualified professional before making any investment decisions.
Source: https://api.follow.it/track-rss-story-click/v3/tHfgumto13DllIbQYLKhGa7VFky8BpXO
- 000
- 77
- 9
- Action
- advice
- analysis
- bearish
- Bitcoin
- BTC
- Bullish
- Bulls
- Creating
- cryptocurrency
- Current
- data
- ETH
- ethereum
- Ethereum Price
- Ethereum Price Analysis
- High
- HTTPS
- index
- information
- investment
- Investments
- IT
- King
- Level
- liability
- Making
- mark
- Market
- Matters
- Momentum
- Opportunity
- Other
- price
- Price Analysis
- research
- serving
- stay
- support
- support level
- test
- time
- Trading
- Trends
- Volatility
- writing