Lowers More – June 21
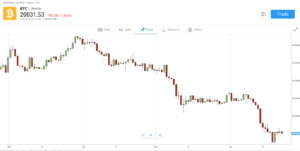
The market worth of ETH/USD yet lowers more at the level of $2,000 since price embarked upon a serial gradual fallings from the point of $2,500. Price trades around the value of $1,946 at a negative rate of -13.26 percent.
Lowers More: ETH Market
Key Levels:
Resistance levels: $2,500, $3,000, $3,500
Support levels: $1,700, $1,500, $1,300
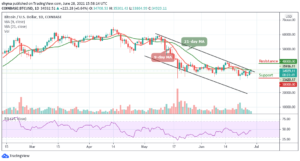
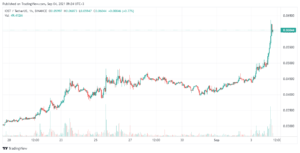
ETH/USD – Daily Chart
It is now again depicted on the ETH/USD daily chart as it happened last on May 23 while a bearish candlestick emerged to briefly breach past the lower level of $2,000. Yet, price lowers more with a high pressure to create a kind of panicking situation for investors and long-position takers of the crypto economy. The 14-day SMA trend-line has closely moved downward in a state of touching the 50-day SMA indicator. The bearish trend-line drew through the SMA trend lines to the south to find a place on top of the starting formation of the present bearish candlestick. The Stochastic Oscillators are in the oversold region to suggest that near exhaustion of falling forces.
ETH/USD price lowers more at $2,000; would there be a long-keep of the price below it?
The ETH/USD market lowers more, and consolidation of price around the level of $2,000 could in the long run lead to a long-keep of the price below the value. In almost the same vein, such a move could result in featuring a line of range-bound trading outlook at a later session. The emergence of a bullish candlestick may not be forthcoming in the near time as there has been no reliable sign to denote just that presently. Therefore, buyers are enjoined to be vigilant of their entry.
In regards to getting to see the crypto’s price lowers more, sellers may have to intensify their presence around the point of $2,000 and, using the sell signal side of the bearish trend-line for rejection of later attempting upswings of the market. Sellers may now have to suspend entering of positions for a while as the market seems to have reached a level that is critical to seeing reliable lowers more of price,
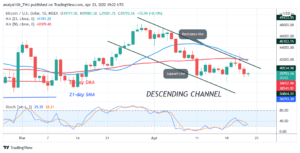
ETH/BTC Price Analysis
The ETH/BTC daily price analysis chart reveals both the bullish trend-line and the 50-day SMA move closely together pointing toward the north suggests that the base crypto still has the higher rate of pushing pairing with the flagship crypto. The 14-day SMA trend-line is located over the 50-day SMA indicator. The Stochastic Oscillators are in the oversold region seemingly moving in a consolidation method to signal ongoing indecision in the market movements. However, the market appears to have a lesser active motion to show the style that the base instrument has been pushed by the counter trading tool.
Looking to buy or trade Ethereum (ETH) now? Invest at eToro!
75% of retail investor accounts lose money when trading CFDs with this provider
Source: https://insidebitcoins.com/news/ethereum-price-prediction-eth-usd-lowers-more-at-2000
- 000
- active
- analysis
- around
- bearish
- breach
- Bullish
- buy
- consolidation
- crypto
- economy
- ETH
- ETH/USD
- ethereum
- ethereum (ETH)
- Ethereum Price
- For Investors
- High
- HTTPS
- investor
- Investors
- IT
- lead
- Level
- Line
- Long
- Market
- money
- move
- Near
- North
- Outlook
- prediction
- present
- pressure
- price
- Price Analysis
- Price Prediction
- retail
- Run
- sell
- Sellers
- South
- State
- time
- top
- trade
- trades
- Trading
- value
- worth