TL;DR Breakdown
- Fantom price analysis is bullish for today, +13% from yesterday’s price.
- Fantom broke resistance at $1.11 earlier today as bulls were in charge.
- The nearest support is present at $1.01 and another at 0.8 USD.
Fantom has performed exceptionally well when compared to other cryptocurrencies. It has been trading with a bullish outlook jumping from $0.4 on 27th August to the current price of $1.2. This huge surge in price brought the attention of major investors and traders, resulting in a new all-time high for the coin. The trading volume for the currency is currently down by 27.71 percent.
The price movement was unable to break the resistance at the $1.11 price level yesterday, although today, it was broken, and the current price of the FTM/USDT pair is at $1.2. According to our Fantom price analysis, the FTM/USDT pair can make a move for another resistance at $1.314. If the price action doesn’t fall at this point and the resistance remains broken, higher prices are possible after a cool-off period.
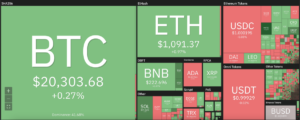
Bitcoin price analysis for today reveals that the cryptocurrency broke a minor resistance at $50K and has found support at that price level. Continuous maintenance of the $50K level can prove to be quite beneficial for future price actions. However, the major resistance at $50.5K is unbroken. If the bulls take charge and this resistance breaks, a new all-time high can be expected.
24-hours Fantom price analysis: Technical indicators are bullish
The technical indicators seem to give off a bullish picture for the FTM/USDT pair as the resistance at $1.11 was broken today. The price action is trading above this resistance, and if FTM is able to convert this resistance into support, we might experience a bullish run to conquer the resistance expected at $1.3. A study of technical indicators on the 4-hour chart has been done to perform a detailed Fantom price analysis.
The FTM/USDT 4-hour chart below represents the Bollinger Bands and the key Moving Averages. It is clear that the price action is situated above the 50-day and the 100-day Moving Averages. Another important observation that is clear from the 4-hour chart below is that the price action broke out from the upper end of Bollinger Band yesterday, and as a result, consecutive red candles were seen.
Thereafter, bullish took charge over the Fantom price action today, and as a result, the resistance at $1.11 was broken, while major support can be found at $0.8. However, these are not the only indicators that we will discuss.

FTM/USD 4-hour chart: Bulls accumulating FTM?
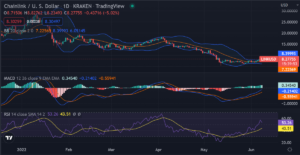
The 4-hour chart below shows the FTM/USDT trading pair with the RSI, Relative Strength Indicator, and the MACD indicator. Both the indicators have proven to be quite accurate when it comes to pinpointing the price action for a cryptocurrency.
The RSI indicator below shows that the trading pair has entered the oversold region with a positive gradient. The positive gradient reveals that this is the best time to sell the cryptocurrency pair and wait for lower prices when the RSI enters a level below 40. But, looking from the RSI readings from the past few days, the price action has been above 50. Therefore, it would be safe to buy the pair at the best prices available at the moment.
In the MACD indicator below, it is clear that the MACD line or the blue line is way above the orange or the signal line. This is a bullish price action signal. The MACD histogram is full of green bars indicating that the bears haven’t yet given up.

Fantom price analysis: Conclusion
From our Fantom price analysis, we can clearly say that this cryptocurrency has performed exceptionally well in the short term, and we might expect higher prices in the longer term. FTM has managed to break the resistance and tripled its value in mere two weeks. Along with Solana (SOL), LUNA, ADA, and XEC, Fantom has performed extraordinarily.
Disclaimer. The information provided is not trading advice. Cryptopolitan.com holds no liability for any investments made based on the information provided on this page. We strongly recommend independent research and/or consultation with a qualified professional before making any investment decisions.Source: https://api.follow.it/track-rss-story-click/v3/tHfgumto13AecJ3FsOUir1T72x6uxjiK
- 11
- Action
- advice
- analysis
- AUGUST
- bars
- Bears
- BEST
- Bullish
- Bulls
- buy
- charge
- Coin
- cryptocurrencies
- cryptocurrency
- Currency
- Current
- data
- Enters
- experience
- full
- future
- Green
- High
- hold
- HTTPS
- huge
- information
- investment
- Investments
- Investors
- IT
- Key
- Level
- liability
- Line
- major
- Making
- move
- Other
- Outlook
- picture
- present
- price
- Price Analysis
- research
- Run
- safe
- sell
- Short
- Solana
- Study
- support
- surge
- Technical
- time
- Traders
- Trading
- USD
- value
- volume
- wait