SNEAK PEEK:
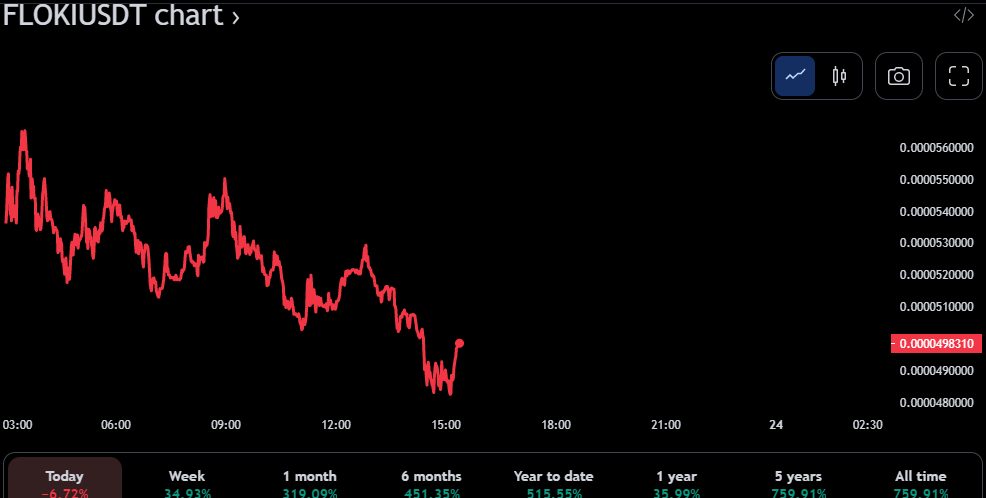
- Floki token price rises as a result of bullish momentum.
- Kelter channel bands suggest a range-bound market.
- Recent analysis reveals bulls have the upper hand in the FLOKI market.
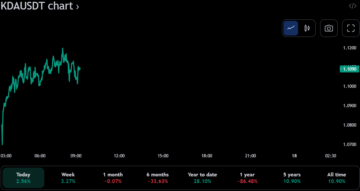
The bulls have been in control of the market over the last day, boosting the price of Floki from an opening price of $0.00042 to a closing price of $0.000050, according to the price analysis of the coin. Moreover, the Floki token made new daily highs of $0.000055 and $0.000054, establishing a resistance level of $0.000055 when the market closed.
Due to the market’s cheerful optimism, the Floki token’s price has risen by 15.22% over the day to a high of $0.000048. As of this writing, the market capitalization of Floki tokens has risen to over $434 million, a 15.15% gain, while the token’s trading volume has risen to $143, a 105.7% increase over its previous value.
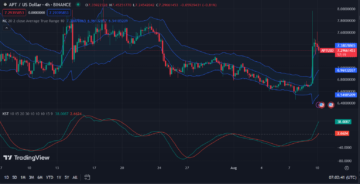
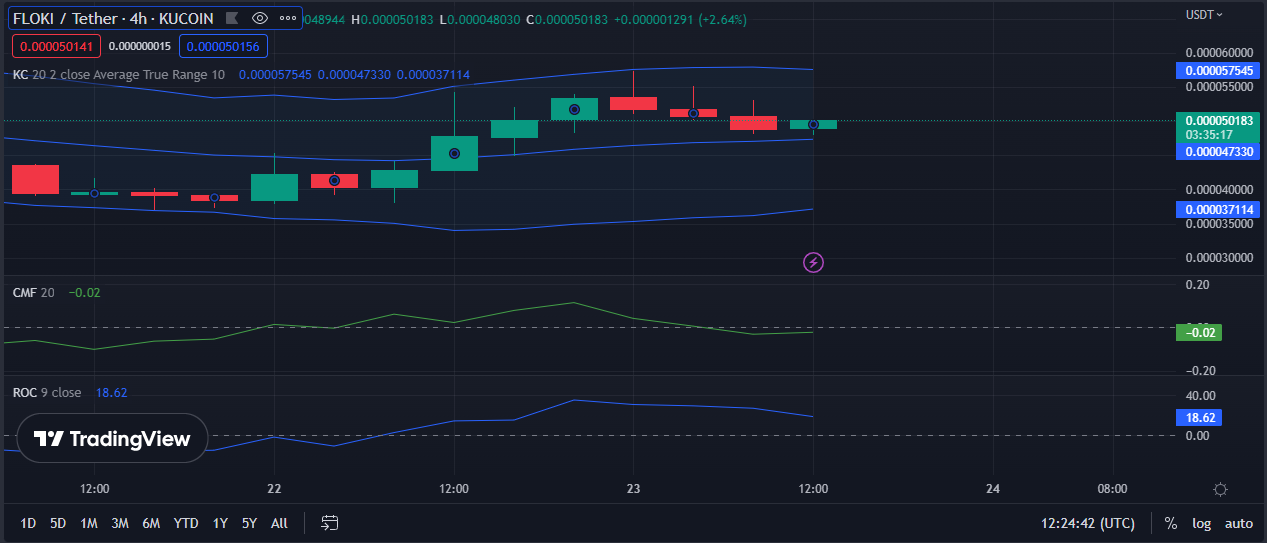
According to the Floki 4-hour chart, the Kelter channel bands are moving linearly, with the upper band touching 0.0000561418 and the lower band touching 0.0000374914, indicating that the market is likely to continue in a narrow range. This motion suggests that the market will likely stay range-bound soon. As a result, the present positive trend in the FLOKI market is likely to be transitory, with a slight negative trend forecast soon.
Since the Chaikin Money Flow (CMF) reading of 0.02 indicates that money is entering the market, the negative trend in the FLOKI market may be postponed, implying that the market may maintain its bullish trend for some time. The proximity to the “0” line indicates that the market will remain volatile in the short term, with modest, bearish, and bullish moves.
The Rate of Change (ROC) value of 15.43 indicates that the market is still bullish but has already reached its high and will likely start a negative trend soon. This movement is supported by its trend south toward the zero line, confirming the presence of negative sentiment in the market. The FLOKI market’s CMF and ROC ratings, taken together, paint a picture of a turbulent market in the foreseeable future.
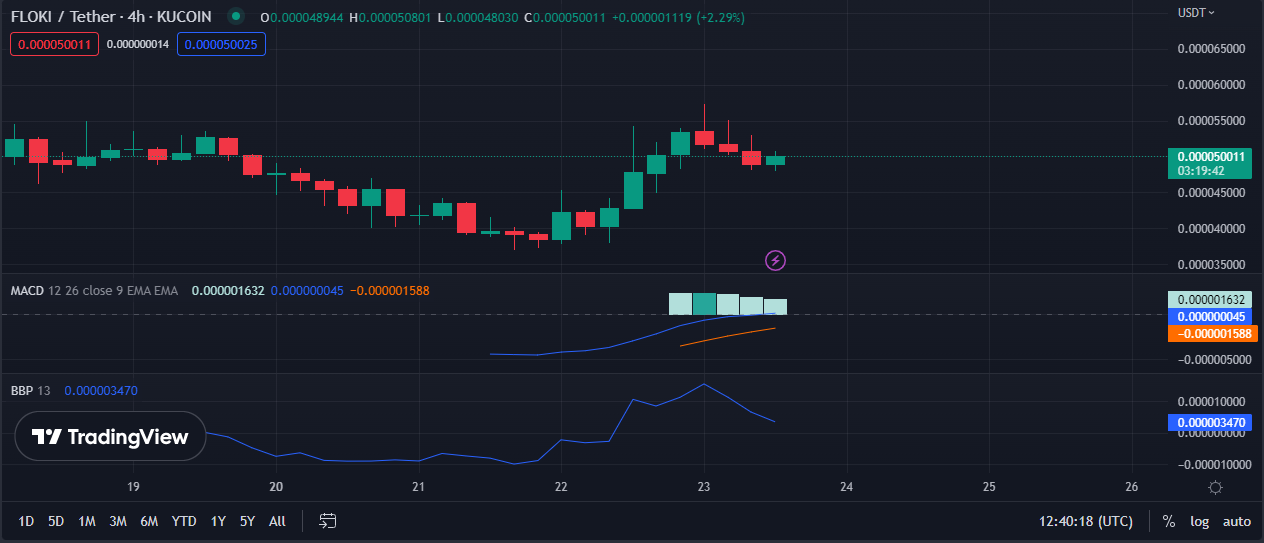
The positive MACD trend in the FLOKI price chart with a level of 0.000000076 adds to the bullish momentum since purchasing pressure is still strong, and the price upswing may continue. This notion, backed by increasing purchasing volume, contributes to the positive momentum and suggests that the FLOKI price rise will progress.
As the MACD indicator’s histogram is above zero, it suggests that the underlying trend in the FLOKI price chart is bullish and that the rising momentum may persist in the near to medium term.
The Bull Bear Power (BBP) likewise moves in the positive zone, indicating that purchasing pressure is still present and that the price increase will likely continue. Therefore, as long as the purchasing pressure is intense and the price trend continues, FLOKI is a decent investment option.
Bulls must attempt to turn current resistance into support for bullish momentum to prevail in the FLOKI market.
Disclaimer: In good faith, we disclose our thoughts and opinions in our price analysis, as well as all the facts we give. Each reader is responsible for his or her own investigation. Reader discretion is advised before taking any action.
- SEO Powered Content & PR Distribution. Get Amplified Today.
- Platoblockchain. Web3 Metaverse Intelligence. Knowledge Amplified. Access Here.
- Source: https://investorbites.com/floki-price-analysis-23-02/
- 15%
- a
- above
- According
- Action
- Adds
- All
- already
- analysis
- and
- backed
- BAND
- Bear
- bearish
- Bears
- before
- boosting
- bull
- Bullish
- Bulls
- capitalization
- change
- Channel
- Chart
- closed
- closing
- Coin
- continue
- continues
- control
- Current
- daily
- day
- Disclose
- discretion
- dominates
- each
- establishing
- FLOKI
- FLOKI Price
- flow
- Forecast
- foreseeable
- from
- future
- Gain
- Give
- good
- hand
- High
- Highs
- HTTPS
- important
- in
- Increase
- increasing
- indicates
- internal
- investigation
- investment
- IT
- Last
- Level
- likely
- Line
- Long
- MACD
- made
- maintain
- Market
- Market Capitalization
- Market News
- medium
- million
- Momentum
- money
- motion
- movement
- moves
- moving
- Near
- negative
- New
- news
- Notion
- opening
- Opinions
- Optimism
- Option
- own
- paint
- picture
- plato
- Plato Data Intelligence
- PlatoData
- positive
- power
- presence
- present
- pressure
- previous
- price
- Price Analysis
- price chart
- Price Increase
- price rise
- Progress
- purchasing
- range
- Rate
- ratings
- reached
- Reader
- Reading
- remain
- Resistance
- responsible
- result
- Revealed
- Reveals
- Rise
- Risen
- Rises
- rising
- sentiment
- Short
- since
- some
- Soon
- Source
- South
- stablecoin
- start
- stay
- Still
- strong
- Suggests
- support
- Supported
- taking
- The
- therefore
- time
- to
- together
- token
- Tokens
- touching
- toward
- Trading
- trading volume
- TradingView
- Trend
- turbulent
- TURN
- underlying
- value
- volatile
- volume
- What
- What is
- while
- will
- writing
- zephyrnet
- zero