Published 3 hours ago
Under the influence of a resistance trendline, the Solana coin price has witnessed an established downtrend for the past ten months. However, amid the U.S. bank crisis, the crypto market has gained more spotlight, triggering a recovery phase in the majority of major cryptocurrencies. Thus, the SOL price is likely to breach the overhead trendline which will be an early sign of trend reversal.
Key Points
- A descending trendline governs the ongoing downtrend in the Solana coin price
- Supply pressure at the overhead resistance trendline threatens the SOL price of a new correction.
- The 24-hour trading volume in the Solana coin is $486.2 Million, indicating a 40% loss.
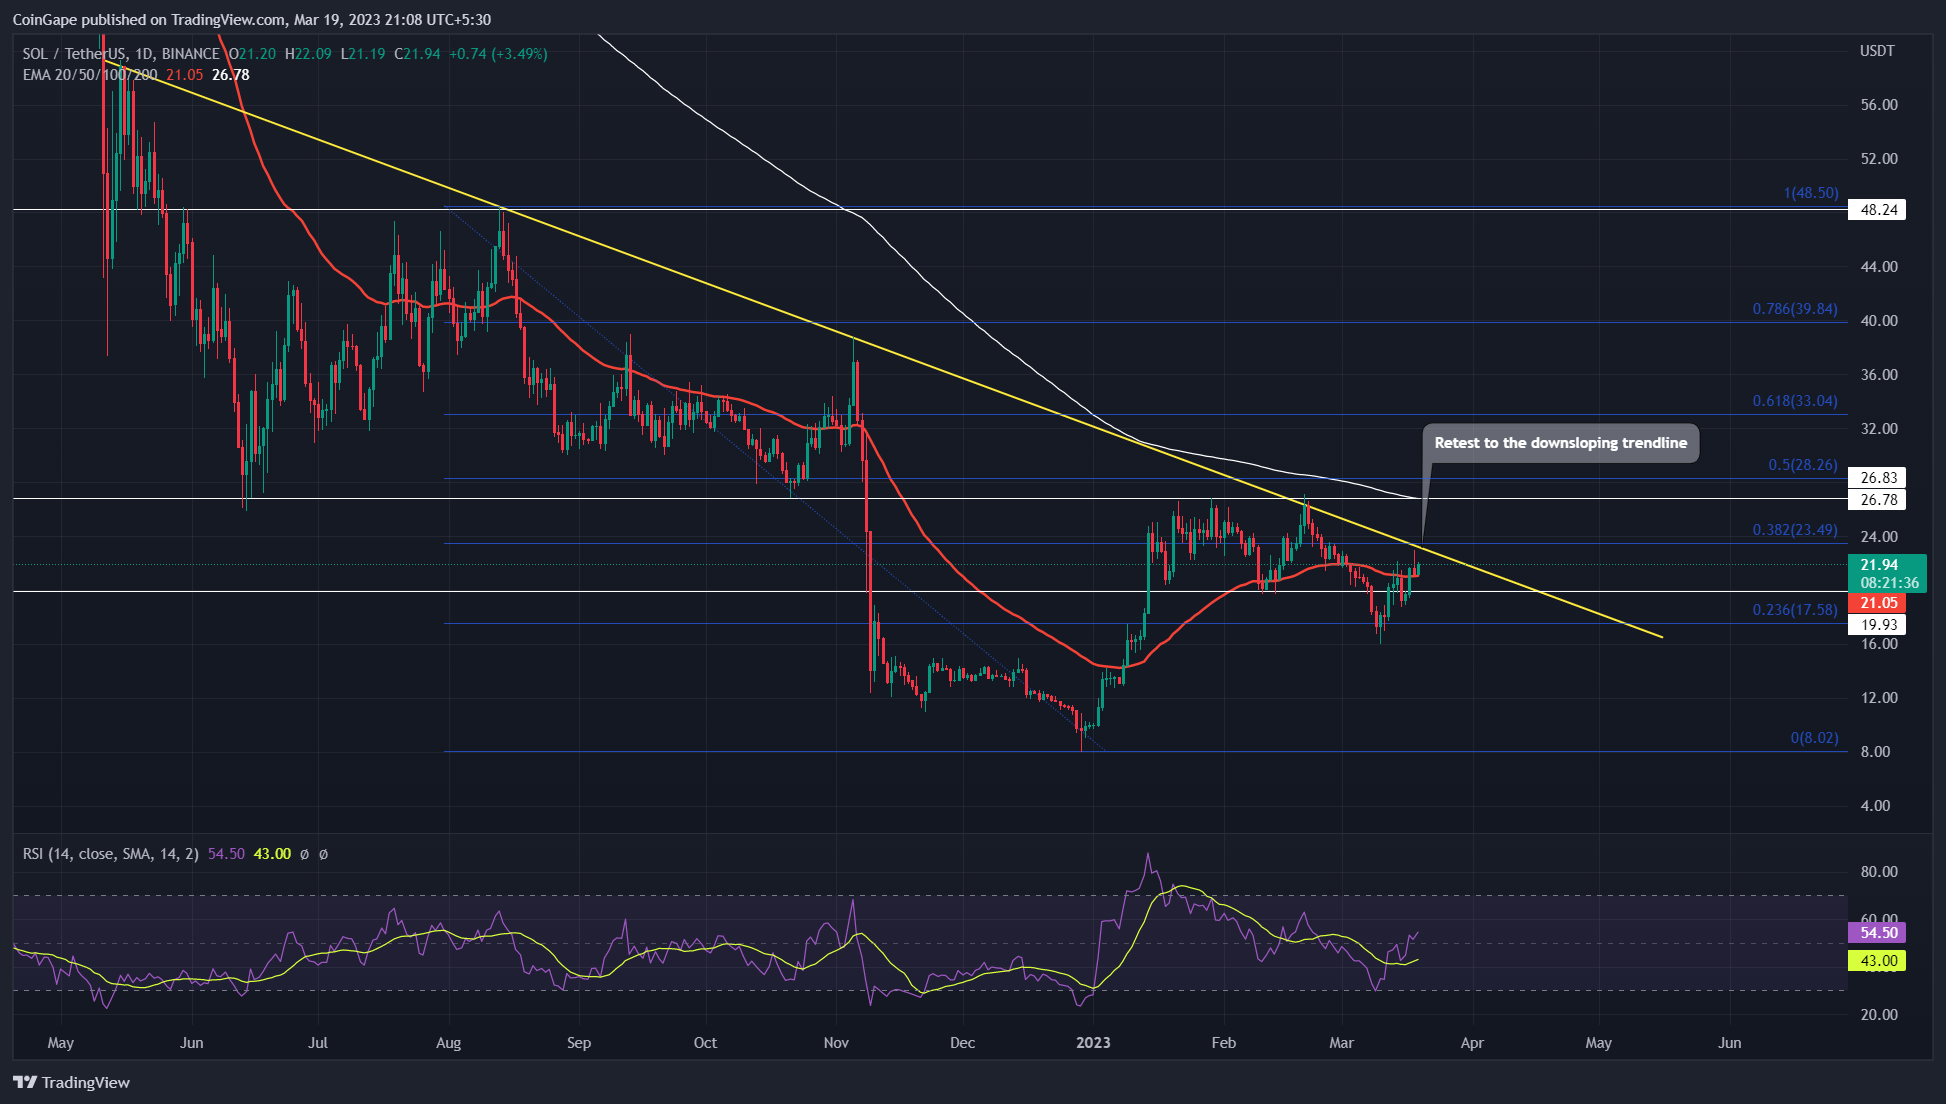
Source-Tradingview
Maintaining an overall downtrend since last year, SOL prices reached the bottom of $9 by the end of 2022. However, with the new year’s recovery in the crypto market, the SOL price witnessed a significant rally and pushed the market value 140% higher.
Trending Stories
Analyzing the declining trend, the recovering SOL prices are struggling to surpass a long-coming resistance trendline. The multiple reversals from the dynamic resistance reflect a long-term struggle where buyers are constantly failing to regain trend control.
As per the Fibonacci retracement, despite the recent correction from combined resistance of $25 and resistance trendline, the buyers propel the prices higher by retaining control at the 23.60% level at $17.
Currently, the Solana price trades at $21.80, with an intraday gain of 2.59%. However, with the altcoin close to the 38.20% Fibonacci level and the resistance trendline, the recovery will soon face bearish opposition.
Also Read: Top 6 Liquid Staking Platforms On Ethereum
Nonetheless, the growing bullish sentiment in 2023 shows a growing possibility of a bull run shortly. Hence, traders can find an entry opportunity with the breakout resistance trendline close to the $23 mark. Bolstering the entry for buyers, the breakout of 38.20% Fibonacci level will improve the sentiment.
On the opposite end, in case of a prolonged correction or a failed breakout, a drop below the $20 mark will nullify the bullish hypothesis. Hence, short-term buyers must keep a stop loss at $20.
Technical Indicator
RSI: the recovering RSI slope in the daily chart projects an inclining trend bouncing from the oversold boundary higher above the halfway line. Thus, highlighting a higher possibility of a prolonged recovery shortly.
EMAs: A bearish gap between the 50-and-200-day EMAs is decreasing as the coin price witnessed a significant recovery so far in the year 2023. A potential golden crossover between these EMAs will accelerate the buying pressure in the market.
Solana Coin Price Intraday Level
- Spot price: $21.8
- Trend: bullish
- Volatility: Medium
- Resistance levels: $22.5 and $27
- Support levels: $20 and $16
Share this article on:
advertisement
The presented content may include the personal opinion of the author and is subject to market condition. Do your market research before investing in cryptocurrencies. The author or the publication does not hold any responsibility for your personal financial loss.
<!– Close Story–>
- SEO Powered Content & PR Distribution. Get Amplified Today.
- Platoblockchain. Web3 Metaverse Intelligence. Knowledge Amplified. Access Here.
- Source: https://coingape.com/markets/is-it-a-good-time-to-buy-solana-sol-detailed-sol-price-analysis-with-entry-levels-stop-loss/
- :is
- 1
- 10
- 2022
- 2023
- 7
- 8
- 9
- a
- above
- accelerate
- Ad
- Altcoin
- Amid
- analysis
- and
- ARE
- article
- AS
- At
- author
- avatar
- Bank
- banner
- BE
- bearish
- Beauty
- before
- below
- between
- blockchain
- Bottom
- breach
- breakout
- Brian
- bull
- Bull Run
- Bullish
- buy
- buyers
- Buying
- by
- CAN
- case
- Chart
- Close
- Coin
- Coingape
- COM
- combined
- condition
- constantly
- content
- control
- crypto
- Crypto Market
- cryptocurrencies
- cryptocurrency
- daily
- Declining
- Despite
- detailed
- different
- Drop
- dynamic
- Early
- Entertainment
- entry
- established
- Ether (ETH)
- Face
- Failed
- far
- Fashion
- Fibonacci
- finance
- financial
- Find
- follow
- For
- from
- Gain
- gap
- Golden
- good
- governs
- Growing
- Have
- higher
- highlighting
- hold
- HOURS
- However
- HTTPS
- i
- improve
- in
- include
- Including
- influence
- investing
- IT
- journalism
- jpg
- Keep
- Last
- Last Year
- Level
- levels
- likely
- Line
- Liquid
- liquid staking
- long-term
- loss
- major
- Majority
- mark
- Market
- market research
- million
- months
- more
- multiple
- New
- of
- on
- ongoing
- Opinion
- Opportunity
- opposite
- opposition
- overall
- past
- personal
- phase
- Platforms
- plato
- Plato Data Intelligence
- PlatoData
- plugin
- possibility
- potential
- presented
- pressure
- price
- Price Analysis
- Prices
- projects
- Propel
- Publication
- pushed
- rally
- reached
- Read
- recent
- recovering
- recovery
- reflect
- research
- Resistance
- responsibility
- retaining
- Reversal
- Run
- s
- sentiment
- Share
- short-term
- Shortly
- Shows
- sign
- significant
- since
- So
- so Far
- SOL
- SOL Price
- SOL price analysis
- Solana
- Solana (SOL)
- solana coin
- Solana Price
- Soon
- Spotlight
- Staking
- Stop
- Struggle
- Struggling
- subject
- surpass
- ten
- The
- These
- threatens
- time
- time to buy
- to
- Topics
- Traders
- trades
- Trading
- trading volume
- TradingView
- Trend
- trending
- triggering
- value
- variety
- volume
- which
- will
- with
- witnessed
- working
- written
- year
- years
- Your
- zephyrnet