Overview
- Total spot trading volume at $2.86 billion, 9% higher than the 30-day average of $2.63 billion.
- Total futures notional at $797.5 million.
- The top five traded coins were, respectively, Ethereum, Bitcoin, Dogecoin, Tether and Ethereum Classic.
- Strong returns from Gnosis (+14%) and Ethereum (+12%).
| May 08, 2021 $2.86B traded across all markets today Crypto, EUR, USD, JPY, CAD, GBP, CHF, AUD |
||||
|---|---|---|---|---|
| ETH $3914.1 ↑12% $797.5M |
XBT $58953. ↑2.7% $795.7M |
XDG $0.6368 ↓7.6% $636.4M |
USDT $1.0014 ↑0.05% $285.3M |
ETC $128.55 ↑7.0% $104.4M |
| ADA $1.6234 ↓1.9% $79.3M |
LTC $347.39 ↑0.6% $50.5M |
XRP $1.5653 ↓1.0% $48.7M |
DOT $39.923 ↑0.07% $43.9M |
BCH $1400.7 ↑4.4% $42.4M |
| USDC $1.0 ↑0.0% $40.4M |
LINK $48.693 ↓1.3% $30.8M |
EOS $10.361 ↓0.26% $29.7M |
TRX $0.1431 ↓3.0% $17.1M |
FLOW $28.668 ↓2.9% $16.1M |
| SC $0.0405 ↓4.7% $15.6M |
STORJ $2.2312 ↓0.4% $14.7M |
ATOM $29.510 ↑3.0% $11.8M |
XLM $0.6155 ↓2.5% $11.6M |
DASH $409.86 ↑1.3% $11.2M |
| XTZ $6.9881 ↓1.3% $10.0M |
QTUM $25.576 ↓4.3% $9.83M |
XMR $476.08 ↑4.6% $9.7M |
KSM $435.0 ↑1.3% $7.39M |
ZEC $315.75 ↓1.3% $6.91M |
| FIL $148.15 ↓1.4% $6.82M |
WAVES $32.449 ↓0.14% $6.57M |
UNI $40.532 ↑2.0% $6.55M |
ALGO $1.5198 ↓3.7% $6.03M |
DAI $1.0011 ↓0.01% $6.0M |
| OMG $11.829 ↓0.15% $5.87M |
LSK $8.4918 ↓6.0% $3.77M |
COMP $782.88 ↑9.6% $3.71M |
ICX $2.6909 ↓1.6% $3.63M |
NANO $9.7242 ↓0.6% $3.63M |
| AAVE $466.93 ↑5.7% $3.39M |
GRT $1.5855 ↓0.6% $3.05M |
OCEAN $1.4907 ↑2.0% $3.02M |
KEEP $0.6183 ↑6.5% $2.98M |
GNO $291.84 ↑14% $2.91M |
| SNX $18.448 ↓1.1% $2.72M |
MANA $1.4419 ↓1.7% $2.67M |
KAVA $6.2917 ↓2.8% $2.6M |
BAT $1.4187 ↑0.6% $2.57M |
CRV $3.5639 ↓2.6% $2.41M |
| KNC $3.4433 ↓2.6% $1.93M |
REPV2 $48.252 ↑1.0% $1.83M |
OXT $0.6666 ↓1.1% $1.68M |
BAL $69.63 ↑7.8% $1.52M |
ANT $10.317 ↓3.2% $1.31M |
| YFI $54058. ↑1.3% $1.3M |
PAXG $1877.6 ↑0.8% $1.12M |
EWT $13.644 ↓4.1% $772K |
REP $46.85 ↓0.3% $714K |
MLN $108.99 ↑0.5% $425K |
| TBTC $58915. ↑1.6% $43.3K |
||||
#####################. Trading Volume by Asset. ##########################################
Trading Volume by Asset
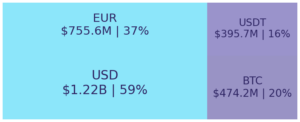
The figures below break down the trading volume of the largest, mid-size, and smallest assets. Cryptos are in purple, fiats are in blue. For each asset, the chart contains the daily trading volume in USD, and the percentage of the total trading volume. The percentages for fiats and cryptos are treated separately, so that they both add up to 100%.
Figure 1: Largest trading assets: trading volume (measured in USD) and its percentage of the total trading volume (May 08 2021)
Figure 2: Mid-size trading assets: (measured in USD) (May 08 2021)
Figure 3: Smallest trading assets: (measured in USD) (May 08 2021)
###########. Daily Returns. #################################################
Daily Returns %
Figure 7: Returns over USD and XBT. Relative volume and return size is indicated by the size of the font. (May 08 2021)
###########. Disclaimer #################################################
The values generated in this report are from public market data distributed from Kraken WebSockets api. The total volumes and returns are calculated over the reporting day using UTC time.
Source: https://blog.kraken.com/post/9008/kraken-daily-market-report-for-may-08-2021/