Litecoin Market Hits Resistance at the Bearish Trend Line – March 20
The trade operations between Litecoin and the US economy have concurrently featured in the descending triangular formation formed as the crypto market hits resistance at the bearish trend line. Price is currently trading between $118 and $112 at a percentage of 2.97 negatives.
Market Hits Resistance at the Bearish Trend Line: LTC Trade
Key Levels:
Resistance levels: $125, $135, $145
Support levels: $100, $90, $80 LTC/USD – Daily Chart
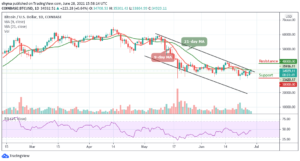
The LTC/USD daily chart shows the crypto-economic market hits resistance at the bearish trend line of the descending triangular pattern that its been keeping over time. The 14-day SMA indicator is underneath the 50-day SMA indicator. The smaller SMA is closer to the baseline at the $100 level. The Stochastic Oscillators are in the overbought region. And they have conjoined the lines in an attempt to cross back southbound within it. That signifies that a falling force is in the offing.
Should traders ride on following a breakout at the bearish trend line as the market hits resistance around it?
It could be technically riskier for traders to follow a breakout at the bearish trend line of the descending triangular pattern that has been formed over time as the LTC/USD market hits resistance around it. The trending outlook so far appears that price will keep within the trading zone of the pattern drawn for some time. Therefore, it might be unsafe to get smooth upward pushes in this crypto’s activities in the subsequent sessions.
On the downside of the technical analysis, the LTC/USD market position takers now have a brighter chance to exert pressure on the crypto-economic price valuation. The situation seems to be getting weaker around the bearish trend line, making up part of the descending triangular pattern. Traders should also note that not much volatility has featured in these crypto business deals. Investors may consider joining the market while it goes dipping afterward.
LTC/BTC Price Analysis
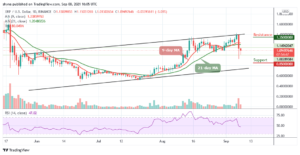
In comparison, Litecoin’s market trends under a bearish setting as it serves as the base to Bitcoin. The cryptocurrency pair market hits resistance around the smaller SMA trend line. The 50-day SMA indicator is above the 14-day SMA indicator. The bearish channel trend lines are to enclose the SMAs in line with the touches of psychological higher points and lower points to the south side. The Stochastic Oscillators are in the overbought region, clogging to signify a consolidation moving style. That reading suggests the base crypto may soon be losing the stances to the counter crypto.
Looking to buy or trade Bitcoin (BTC) now? Invest at eToro!
68% of retail investor accounts lose money when trading CFDs with this provider.
Read more:
- "
- activities
- analysis
- around
- Baseline
- bearish
- Bitcoin
- breakout
- BTC
- business
- buy
- buy bitcoin
- closer
- consolidation
- could
- crypto
- Crypto Market
- cryptocurrency
- Deals
- Display
- economy
- featured
- follow
- following
- getting
- higher
- HTTPS
- investor
- Investors
- IT
- keeping
- Level
- Line
- Litecoin
- Litecoin price
- LTC
- LTC/USD
- Making
- manager
- March
- Market
- Market Trends
- money
- more
- moving
- Operations
- Outlook
- Pattern
- percentage
- prediction
- pressure
- price
- Price Prediction
- public
- Reading
- retail
- setting
- So
- South
- style
- Technical
- Technical Analysis
- time
- trade
- Traders
- Trading
- trending
- Trends
- us
- US economy
- Valuation
- visibility
- Volatility
- W3
- within