Published 18 hours ago
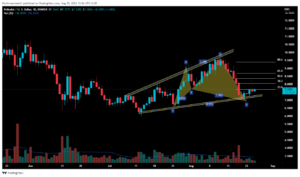
On September 18th, the Litecoin price triggered a rising parallel channel pattern with the breakdown of the long-coming support trendline. However, the price is currently stuck in a retest phase, and the lower price rejection candles there indicate weakness in buyer’s commitment. Thus, the interest needs better confirmation before they position their fund in LTC.
advertisement
Key points Litecoin price analysis:
- The channel pattern breakdown hints at the continuation of the prevailing downtrend
- A slight bullish divergence in the RSI slope indicates rising bullish momentum
- The intraday trading volume in the Litecoin coin is $828.5 Million, indicating a 47.5% gain.

Source-Tradingview
The LTC price maintained an uptrend for the past three months under the influence of a rising channel pattern. The bullish channel registered a 66.5% rise as the coin price marked a record high of $67.7.
However, in theory, the rising channel is a bearish continuation pattern and intensifies the bearish momentum with the breakdown of the support trendline. Moreover, the Litecoin price struggled to surpass the monthly resistance of $64.
Trending Stories
Amid the recent sell-off in the crypto market, the altcoin turned down from the $64 levels and gave a massive break down from the support trendline. The following retests phase tests the broken support trendline providing a lucrative selling opportunity.
However, the altcoin is struggling to sustain below the $52.2 local support, and the Doji-type candle formation indicates uncertainty among market participants.
Thus, a candle closing below $52.2 will give a better confirmation of potential downfall. Thus a prolonged correction phase will tumble the prices 24% down to $41 support.
However, despite the crumbling market conditions and the increasing volatility questioning the uptrend, a price jump above the support trendline will change the dynamics.
Technical indicator
DMI: with a post-retest reversal, the bearish gap between the DI lines will increase, intensifying the underlying bearishness. Meanwhile, the trend momentum falls as the ADX line maintains a declining trend.
advertisement
EMAs: the downsloping 20-and-50-day EMA may assist sellers in continuing the bearish trend.
- Resistance Levels: $57.5 and $64
- Support Levels: $52 and $47
Share this article on:
The presented content may include the personal opinion of the author and is subject to market condition. Do your market research before investing in cryptocurrencies. The author or the publication does not hold any responsibility for your personal financial loss.
- Bitcoin
- blockchain
- blockchain compliance
- blockchain conference
- coinbase
- Coingape
- coingenius
- Consensus
- crypto conference
- crypto mining
- cryptocurrency
- decentralized
- DeFi
- Digital Assets
- ethereum
- Litecoin
- Litecoin price analysis
- machine learning
- non fungible token
- plato
- plato ai
- Plato Data Intelligence
- Platoblockchain
- PlatoData
- platogaming
- Polygon
- Price Analysis
- proof of stake
- W3
- zephyrnet