In this analysis, we utilize concepts borrowed from thermodynamics, to model behaviour of Bitcoin market participants during cyclical tops and bottoms. What we seek are rapid phase changes, analogous to the transition between bull and bear market regimes.


Introduction
This article aims to highlight an analogy between the Water Phase Diagram and the behaviour of Bitcoin market participants during cyclical tops/bottoms.
Pure Substance Phase Diagrams (Thermodynamics)
Pure Substance Phase Diagrams are well-known tools for estimating the Phase (mechanical state) of Pure Substance at different pressure, volumes and temperatures in thermodynamics and chemical engineering fields. For explanatory purposes, we articulate our analogy using Water as a pure sample substance in this Market Pulse.
Intrinsically, Water can be found in each of the following Single Phase conditions in nature:
- Solid phase 🧊
- Liquid phase 💧
- Vapour phase ☁️
The following figure shows the steps involved in the process of heating up Water, starting from Ice until it becomes Vapour (Steam).
- Solid (Single Phase)
- Liquid and Solid (Two-Phase Mixture in equilibrium)
- Saturated Liquid (Single Phase)
- Wet vapour or Liquid-Vapour mixture (Two-Phase Mixture in equilibrium)
- Saturated Vapour (Single Phase)

Liquid-Vapour Phase Diagram & Lever Rule
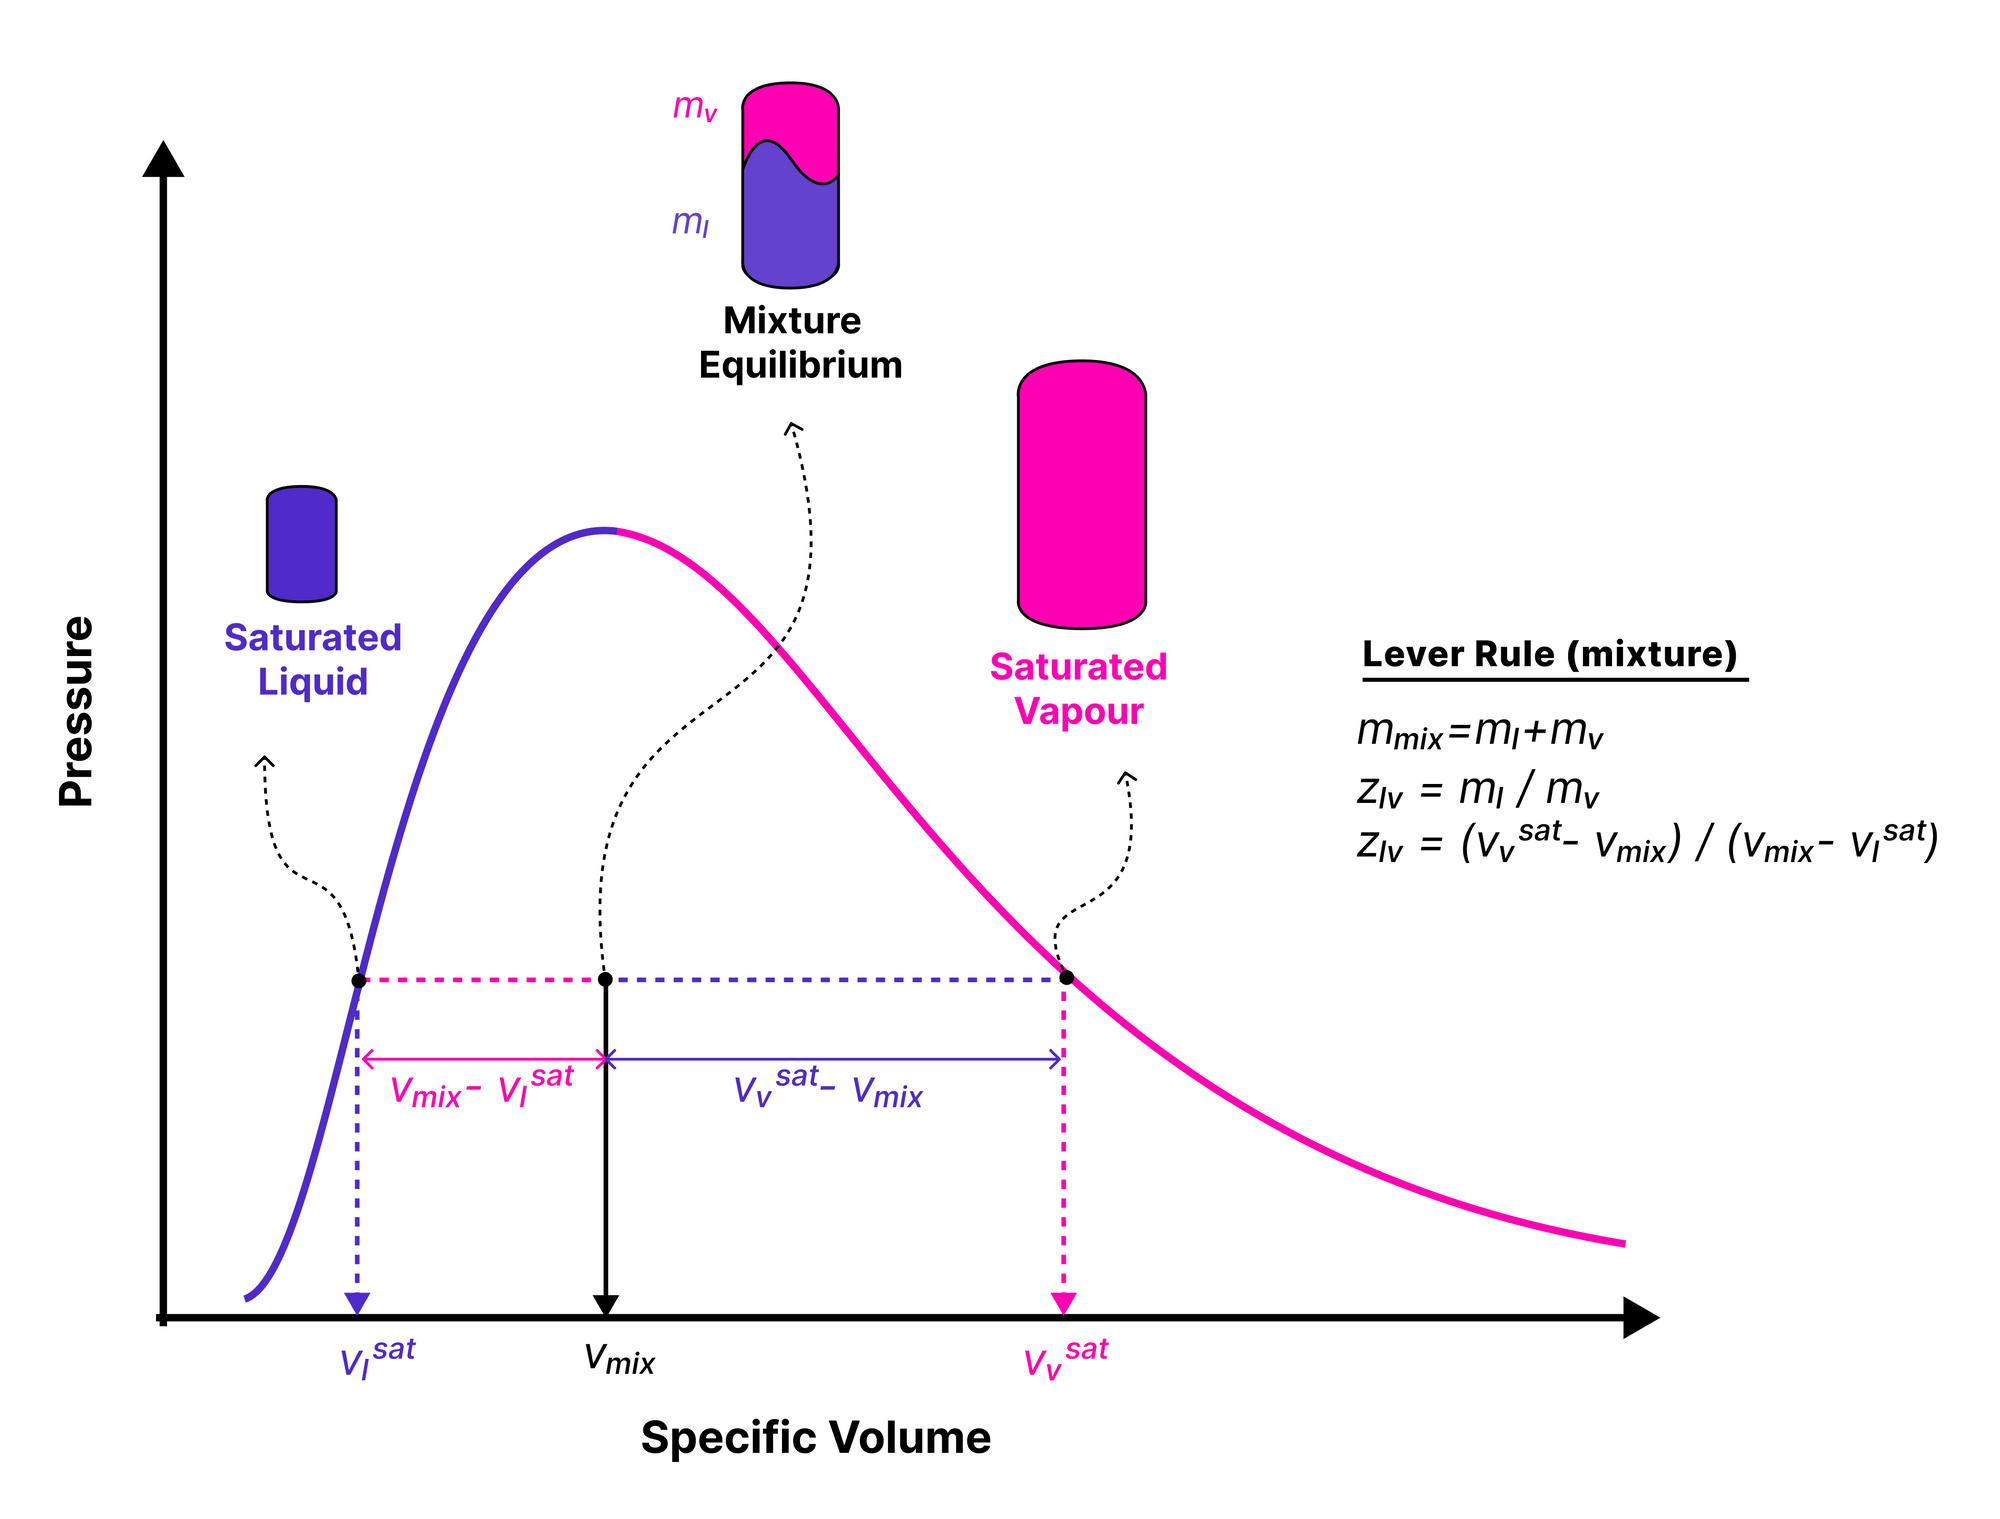
This article aims to highlight an analogy between the Water Phase Diagram and the behaviour of Bitcoin market participants during cyclical tops/bottoms. To satisfy this purpose, the main concentration is on stage 4 of the Water Phase Diagram (Figure 1, Stage 4), where both the Liquid and Vapour phases of Water are available in Equilibrium (LVE).
While a system is in the LVE stage, depending on the direction of energy dQ>0 (Heating) or dQ<0 (Cooling), the mixture state can converge to the saturated-vapour state (Vapour_sat) on the right or to the saturated-liquid state (Liquid_sat) on the left (Figure 2: —).
In Thermodynamics, the relative condition of a two-phase mixture with respect to the bounding points is measurable by Lever Rule. Based on the Lever Rule, the ratio of liquid mass to vapour mass Z_lv at any arbitrary point during the LVE stage can be formulated as follow.

The v_l (sat) and v_v(sat) are empirically pre-determined constant values, which are then employed in Lever Rule to estimate the Vapour/Liquid Mass Ratio (Z_lv) at any arbitrary mixture-specific volume v_eq.
Application:
Bitcoin Market and Phase Diagram Analogy
After describing the principles of the Liquid-Vapour Equilibrium (LVE) and Lever Rule, we can now introduce the analogy between the Bitcoin On-chain metrics and the Water Phase Diagram.
As a general principle, throughout the Bitcoin market cycles, the circulating supply is a combination of two divisions;
- Supply in Loss 🟥: All coins that have a cost basis lower than the current spot price
- Supply in Profit 🟩: All coins that have a cost basis higher than the current spot price
The following figure presents the relative share of supply in the loss and profit.

Considering the previous market cycles, there are three distinguishing states in each cycle:
- Bottom Discovery (Loss-Dominance)🟥: At the very last stages of the bear market, when an extended period of price depreciation causes the share of supply in loss to be dominant (Percent of Supply in Profit < 55%)
- Euphoria (Profit-Dominance)🟩: When a parabolic price uptrend is in play during the bull market, the share of supply in profit becomes dominant (Percent of Supply in Profit > 95%)
- Bull/Bear Transition (Profit-Loss Equilibrium)🟧: The transition periods between the other two described conditions, where supply profitability remains close to equilibrium. (55% < Percent of Supply in Profit < 95%.)

Defining the fundamentals, the proposed analogy can be concluded by considering the following pairs of equivalent states between the market and phase diagram:
- Bottom Discovery (Loss-Dominance) ≡ Approaching saturated-liquid state (Liquid_sat)
- Euphoria (Profit-Dominance) ≡ Approaching saturated-vapour state (Vapour_sat),
- Price or Cost-Basis ≡ Specific volume
Therefore, the specified volumes in the phase diagram can correspond to the well-known on-chain cost bases below.
- Cost-Basis of Supply in Loss (CB_loss) ≡ Specific volume at the saturated-liquid state v_v (sat). Approaching market price to this level can be translated into higher entropy in the market (similar to the vapour phase), which increases the potential for demand exhaustion.
- Cost-Basis of Supply in Profit (CB_profit) ≡ Specific volume at the saturated-vapour state v_l (sat). Diverging to this cost basis is associated with the rising stress inflicted on the market by the shrinking of profit in profit.
- Market Price ≡ Mixture specific volume v_mix.
As mentioned above, the Volume at saturate-liquid and -vapour states v_l (sat) and v_v (sat) are known values. Therefore, we need to calculate the analogous terms using on-chain data before applying the Lever Rule in Bitcoin market behavioural analysis.
Cost-Basis of Supply in Loss and Profit
The cost basis of a specific cluster of market investors is equal to the aggregated unrealized USD value divided by the volume of coins owned by this cluster. The following chart demonstrates the Relative Unrealized Profit [USD-Value] or total profit in USD of all coins in existence whose price at realization time was lower than the current price normalized by the market cap.

The following chart presents the Relative Unrealized Loss [USD-Value] or total profit in USD of all coins whose price last time moved was above the current price normalized by the market cap.

Having the volume share of coins in loss and profit from Circulating Supply (Figure 3), the cost-basis of these divisions can be calculated via the formula below:

The historical resulting cost basis for the investors in loss 🔴 and profit 🔵 are illustrated alongside the spot price in the following chart.

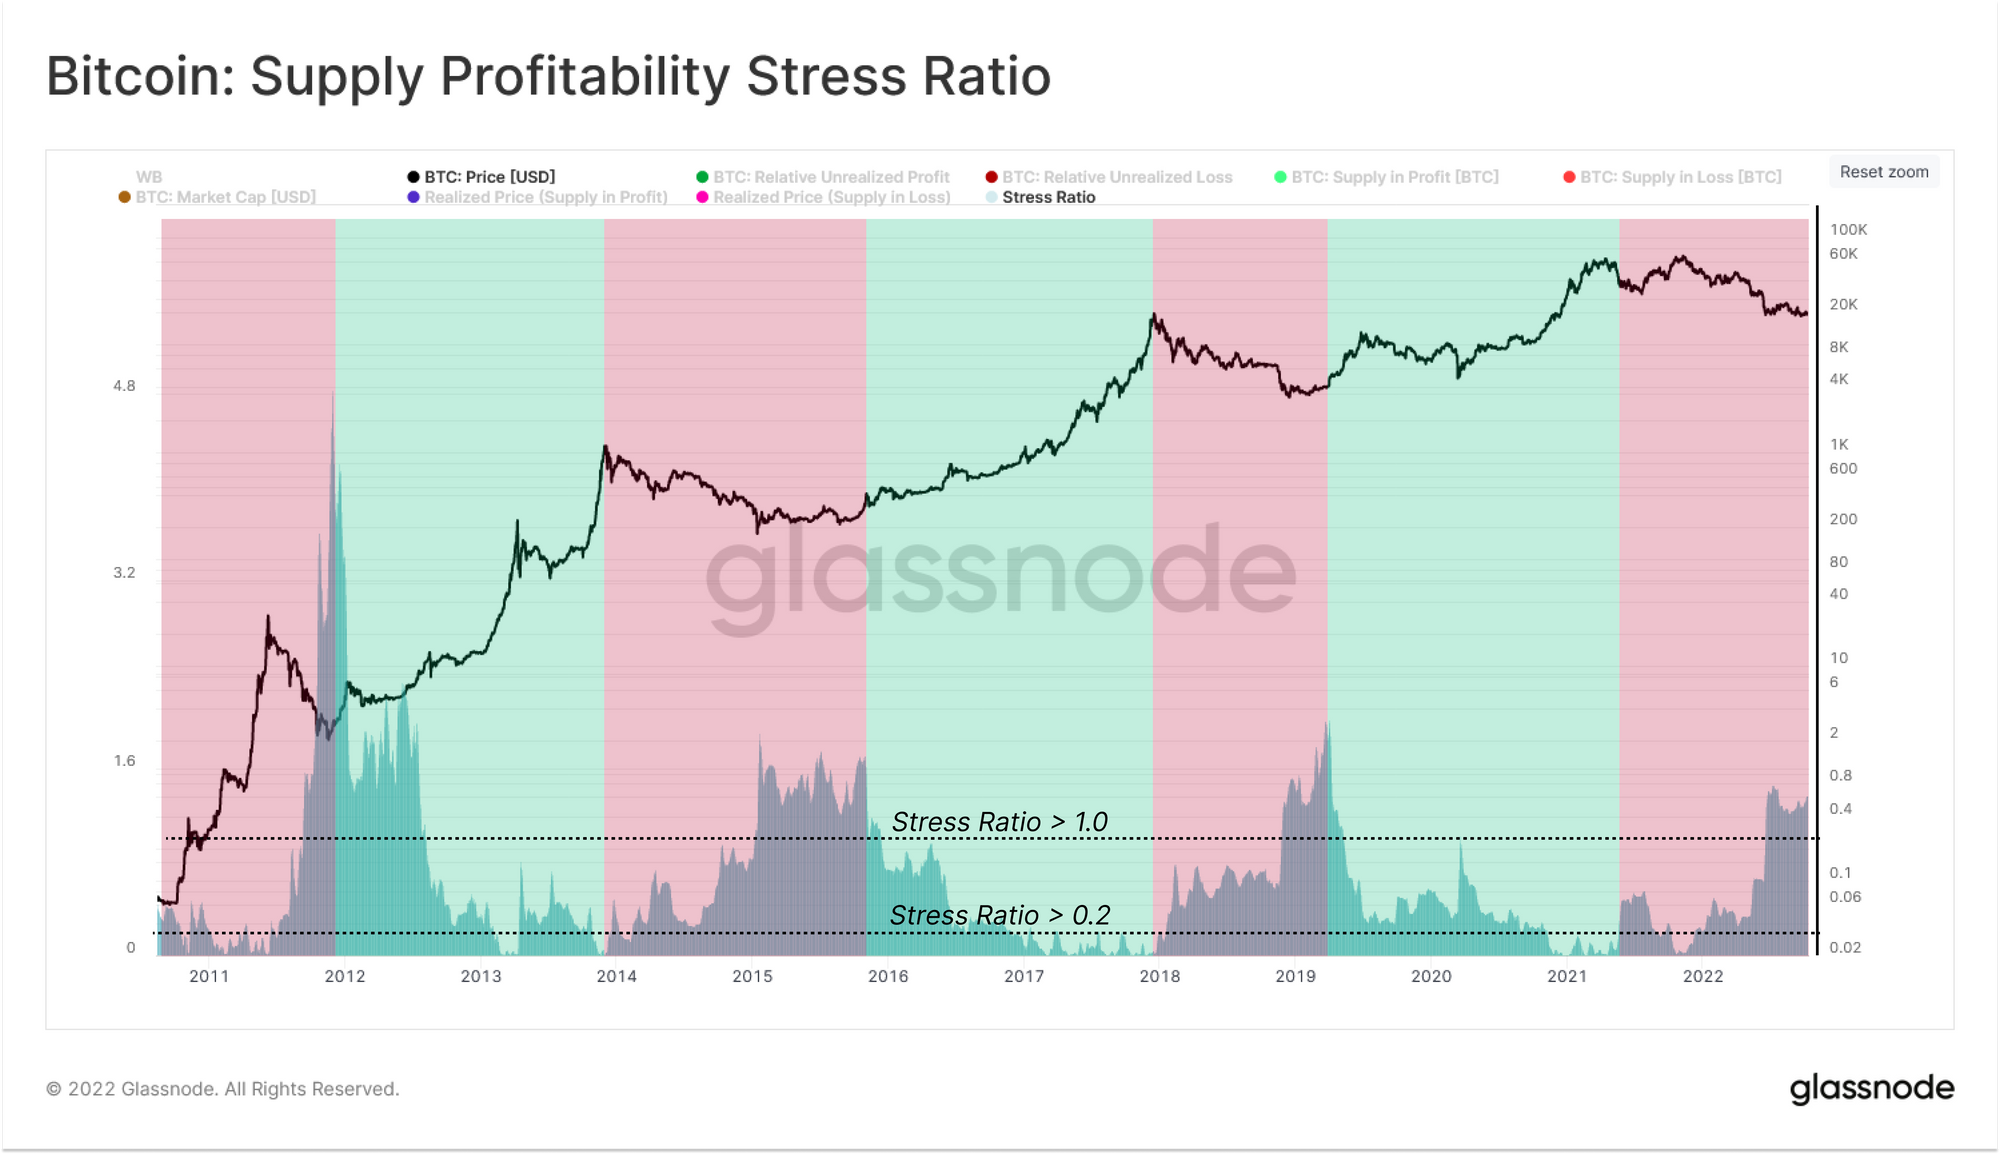
Profitability Stress Ratio
Finally, employing the required component in Lever Rule, we can introduce a new metric called Profitability Stress Ratio, which is identical to the Liquid/Vapour Mass Ratio (Z_lv) and measures the stress inflicted by the relative magnitude supply in the loss.
- Profitability Stress Ratio ≡ Liquid/Vapour Mass Ratio (Z_lv)

The behaviour of this new metric can be considered under the following framework:
- Shrinking Profitability🟥: After hitting the cycle ATH, the market enters a diminishing demand. Consequently, the market continues to devalue, adding to the volume of coins in the loss. The growing magnitude of loss in the market manifests itself in the rising of the Profitability Stress Ratio to values above 0.2. Interestingly, the maximum stress ratio (>1) confluences with the bear market global bottom.
- Expanding Profitability🟩: Adversely, throughout the bull market, with returning demand to the market, price begins to appreciate. The consequent growth of supply in profit reflects itself in the Profitability Stress Ratio converging levels below 0.2.
Conclusion
In this edition, we employ the well-known Water Phase Diagram and Lever Rule in thermodynamics used to estimate the physical properties of the liquid water and ice mixture. Utilizing the aforementioned analogy between these concepts and the status of Bitcoin market profitability, we are able to produce a new metric that attempts to measure the inflicted Profitability Stress across the supply.
Thus, the Profitability Stress Ratio measures the relative deviation of market profitability from the state of Euphoria, where 100 percent of the supply is in profit, and Extreme Fear, where more than 50 percent of the supply is in a loss.

- Bitcoin
- blockchain
- blockchain compliance
- blockchain conference
- coinbase
- coingenius
- Consensus
- crypto conference
- crypto mining
- cryptocurrency
- decentralized
- DeFi
- Digital Assets
- ethereum
- Glassnode
- machine learning
- Market Pulse
- non fungible token
- plato
- plato ai
- Plato Data Intelligence
- Platoblockchain
- PlatoData
- platogaming
- Polygon
- proof of stake
- W3
- zephyrnet