SNEAK PEEK
- Quant token experiences bullish momentum after a recent bearish trend.
- Bullish momentum indicated by Bollinger bands, RSI, and MACD.
- Market sentiment is turning positive, but sustainability is uncertain.
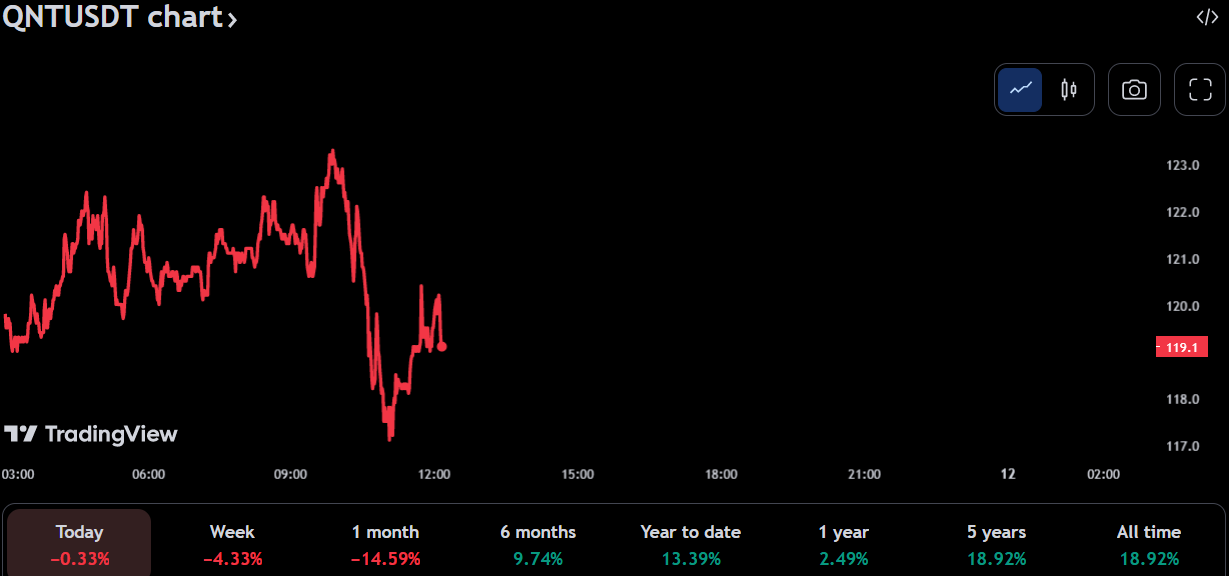
According to Quant Price Analysis, the bears have been in command of the token for the past seven days. As a result, the token’s price plummeted to lower lows of $106.42 and $108.2. However, the bulls have gained the upper hand in the previous 24 hours and drove prices higher, surpassing a new intraday high of $123.35.
Further, the bullish momentum could imply that the market sentiment is turning positive and investors are gaining confidence in the asset, leading to increased buying pressure and a possible uptrend soon. Nevertheles, it remains to be seen whether this upswing is sustainable or only a short-term fluke.
Contrary, an imminent optimistic sentiment is predicted if the bulls maintain their vigor and push the market beyond the present resistance level of $123.37. Nonetheless, a change towards a bearish market trend may be indicated if the bears seize control and drop prices below the support level of $106.36.
At the time of writing, the Quant token has had an intraday boost of 7.51% to $119.23.In addition, the token’s market cap is valued at $1.42 billion, an increase of 7.88% in the last 24 hours, while its trading volume has also increased by 51.86% to $48 million.
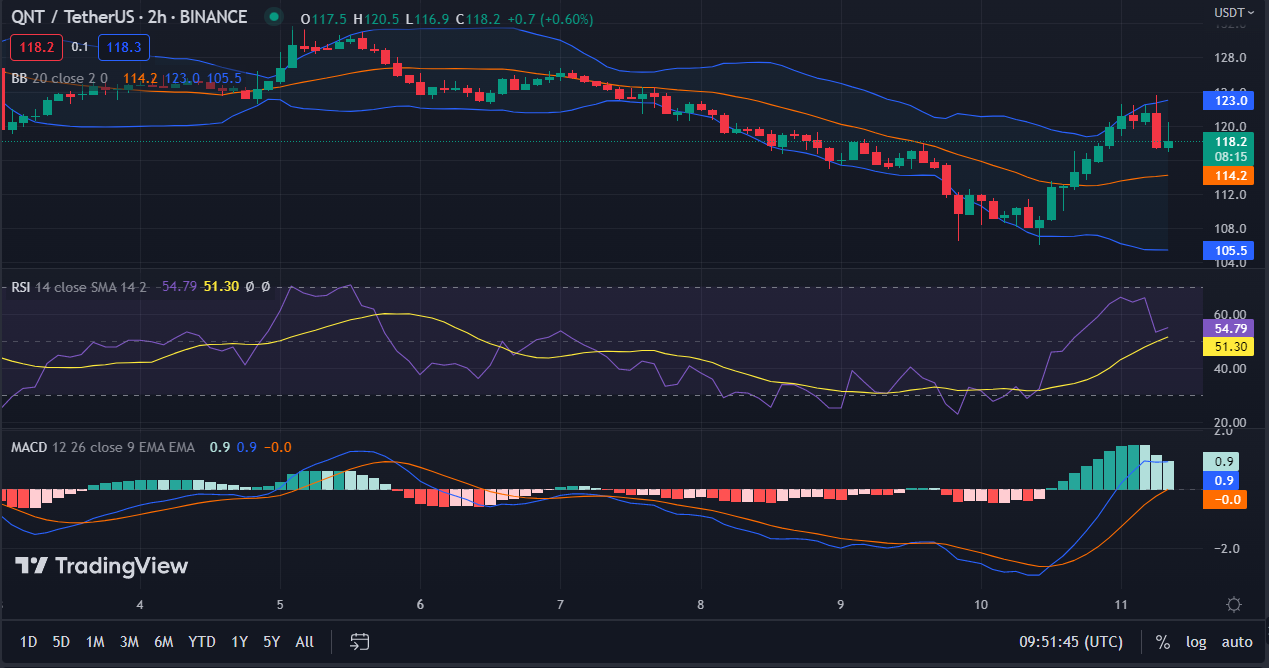
According to the 2-hour price chart, the Bollinger bands are bulging, indicating that the asset’s price exhibits high volatility and may be embracing a significant price movement. Moreover, the Qaunt token is trading on the upper arm of the Bollinger band, implying that the bulls are currently in control of the market and that there may be a potential for a price breakout.
On the same accord, the Relative Strength Index is moving upward, suggesting a bullish mood surrounding the Quant token. Furthermore, the RSI has crested the signal line at 54.79, lending credence to the bullish outlook. Investors may want to contemplate buying in anticipation of a potential price increase.
The Moving Average Convergence Divergence also supports the bullish impetus, as the MACD line is moving in the positive region at 0.9. Moroever, the histogram attests to the strength of the uptrend, with bars increasing in size and moving further into positive territory. This suggests that investors are optimistic about the market and are likely to continue buying, driving prices higher. Notably, monitoring prospective market threats that could reverse this trend is essential.
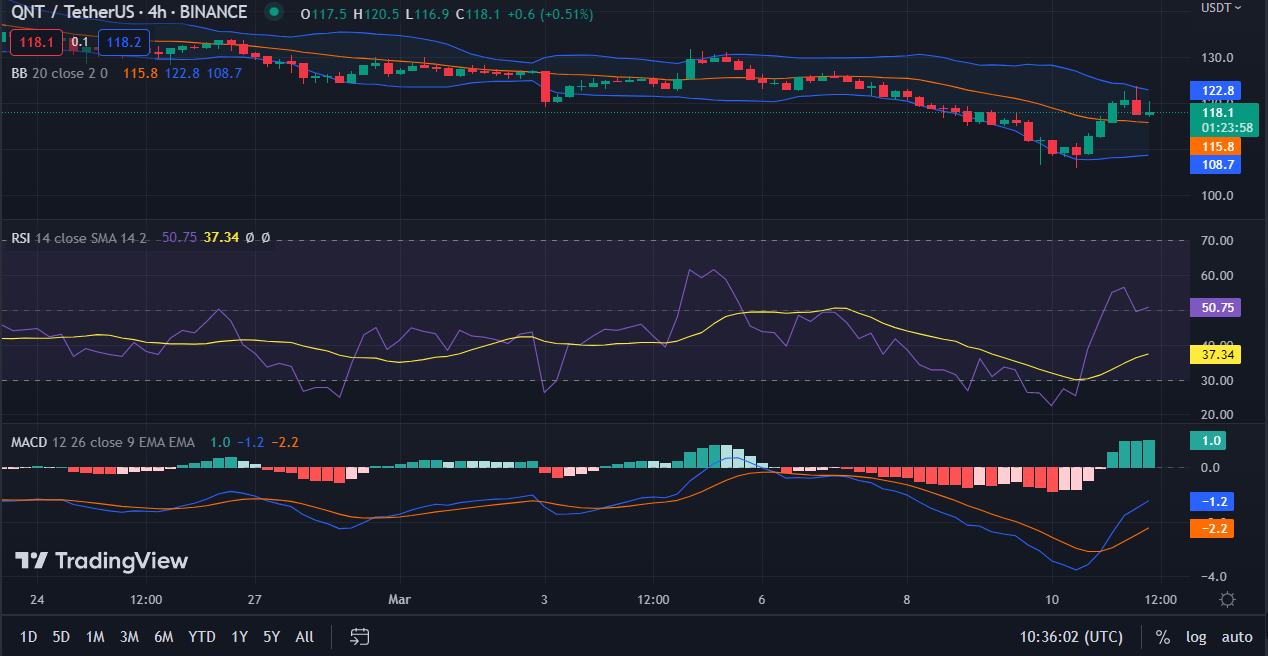
On the 4-hour chart, the Relative Strength Index is hovering at 50.95, signifying that the market is in an impartial state where it is neither overbought nor oversold. Nonetheless, the RSI line strives to ascend, denoting that bullish momentum is building up in the market. Traders may want to keep an eye on the RSI to see if it traverses over 70, indicating an overbought condition. Alternatively, if the RSI drops below 30, it could signal an oversold market and a potential buying opportunity.
Additionally, the Moving Average Convergence Divergence reveals that the bulls are winning over the market, as it shows the MACD line rising upwards. Also, the MACD line is moving above its signal line, which shows that the upward trend is strong and likely to stay strong for a while. This might be a good moment to purchase for traders looking to capitalize on the trend.
On the other hand, the Bollinger bands are gradually expanding, indicating that the market is getting more volatile and that a breakout in any direction is possible. The top bar of the Bollinger band is trading at $122.8, while the bottom band is trading at $108.7, reflecting that the asset is trading within a big price range, and traders may want to consider applying a strategy that takes advantage of this volatility.
However, the Quant token price is trading in the vicinity of the highest band of the Bollinger band, meaning that the bulls are in control and that a bullish burst is possible in the near future.
In light of the Quant token bullish attitude, it is crucial to remember that market circumstances may change fast, and there is always the risk of unforeseen occurrences affecting the Quant token price.
As a result, traders should be vigilant to price movement and ponder using suitable risk management techniques.
Disclaimer: In good faith, we disclose our thoughts and opinions in our price analysis and all the facts we give. Each reader is responsible for his or her investigation. Reader discretion is advised before taking any action.
- SEO Powered Content & PR Distribution. Get Amplified Today.
- Platoblockchain. Web3 Metaverse Intelligence. Knowledge Amplified. Access Here.
- Source: https://investorbites.com/quant-qnt-price-analysis-11-3/
- :is
- $UP
- 7
- 70
- 8
- 9
- a
- About
- above
- Action
- addition
- ADvantage
- affecting
- After
- All
- always
- analysis
- and
- anticipation
- Applying
- ARE
- ARM
- AS
- ascend
- asset
- At
- attitude
- average
- BAND
- bar
- bars
- BE
- bearish
- bearish market
- Bears
- before
- below
- Beyond
- Big
- Billion
- Bollinger bands
- boost
- Bottom
- breakout
- Building
- Bullish
- Bulls
- Buying
- by
- cap
- capitalize
- change
- Chart
- circumstances
- condition
- confidence
- Consider
- continue
- control
- Convergence
- could
- crucial
- Currently
- Days
- direction
- Disclose
- discretion
- Divergence
- driving
- Drop
- Drops
- each
- embracing
- essential
- exhibits
- expanding
- Experiences
- eye
- faith
- FAST
- For
- further
- Furthermore
- future
- gaining
- getting
- Give
- good
- gradually
- hand
- Have
- High
- higher
- highest
- HOURS
- However
- HTTPS
- in
- Increase
- increased
- increasing
- index
- indicated
- internal
- investigation
- Investors
- IT
- ITS
- Keep
- Last
- leading
- lending
- Level
- light
- likely
- Line
- looking
- Lows
- MACD
- maintain
- management
- Market
- Market Cap
- Market News
- market sentiment
- meaning
- might
- million
- moment
- Momentum
- monitoring
- mood
- more
- Moreover
- movement
- moving
- moving average
- Near
- Neither
- New
- news
- notably
- of
- on
- Opinions
- Opportunity
- Optimistic
- Other
- Outlook
- past
- plato
- Plato Data Intelligence
- PlatoData
- ponder
- positive
- possible
- potential
- predicted
- present
- pressure
- previous
- price
- Price Analysis
- price chart
- Price Increase
- Prices
- purchase
- Push
- QNTUSDT
- Quant
- Quant price analysis
- range
- Reader
- recent
- region
- relative strength index
- remains
- remember
- Resistance
- responsible
- result
- Reveals
- reverse
- rising
- Risk
- risk management
- rsi
- same
- sees
- Seize
- sentiment
- seven
- short-term
- should
- Shows
- Signal
- significant
- Size
- Soon
- Source
- State
- stay
- Strategy
- strength
- strives
- strong
- Suggests
- suitable
- support
- support level
- Supports
- Surrounding
- Sustainability
- sustainable
- takes
- taking
- techniques
- that
- The
- their
- threats
- time
- to
- token
- top
- towards
- Traders
- Trading
- trading volume
- TradingView
- Trend
- Turning
- Uncertain
- unforeseen
- uptrend
- upward
- upwards
- valued
- volatile
- Volatility
- volume
- week
- whether
- which
- while
- winning
- with
- within
- writing
- zephyrnet