Legacy finance defines a bear market as a period of prolonged price decline in which the asset price drops by 20% or more from recent highs.
There is no standardized definition of a crypto bear market. But given that digital assets are much more volatile, it’s argued that the percentage drop, by which a crypto bear market is determined, should be -40%, perhaps -60%.
Nonetheless, with the market down roughly 74% from its peak over ten months, there is no doubt the crypto bear is here for Bitcoin.
On June 18, BTC posted a local bottom of $17,700, marking a closing price below the previous cycle peak for the first time in its history. Some analysts called this the market cycle bottom. However, analysis of several on-chain metrics suggests otherwise.
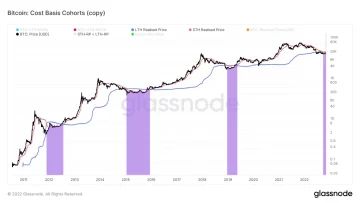
Percentage of Bitcoin addresses in profit
The percentage of Bitcoin addresses in profit refers to the proportion of unique addresses whose funds have an average buy price lower than the current price.
In this case, the “buy price” is defined as the price at the time of token transfer into an address.
During each previous cycle bottom, 50% or fewer Bitcoin addresses have been in loss. The chart below shows a current reading of around 58%, suggesting the BTC price has further to fall.

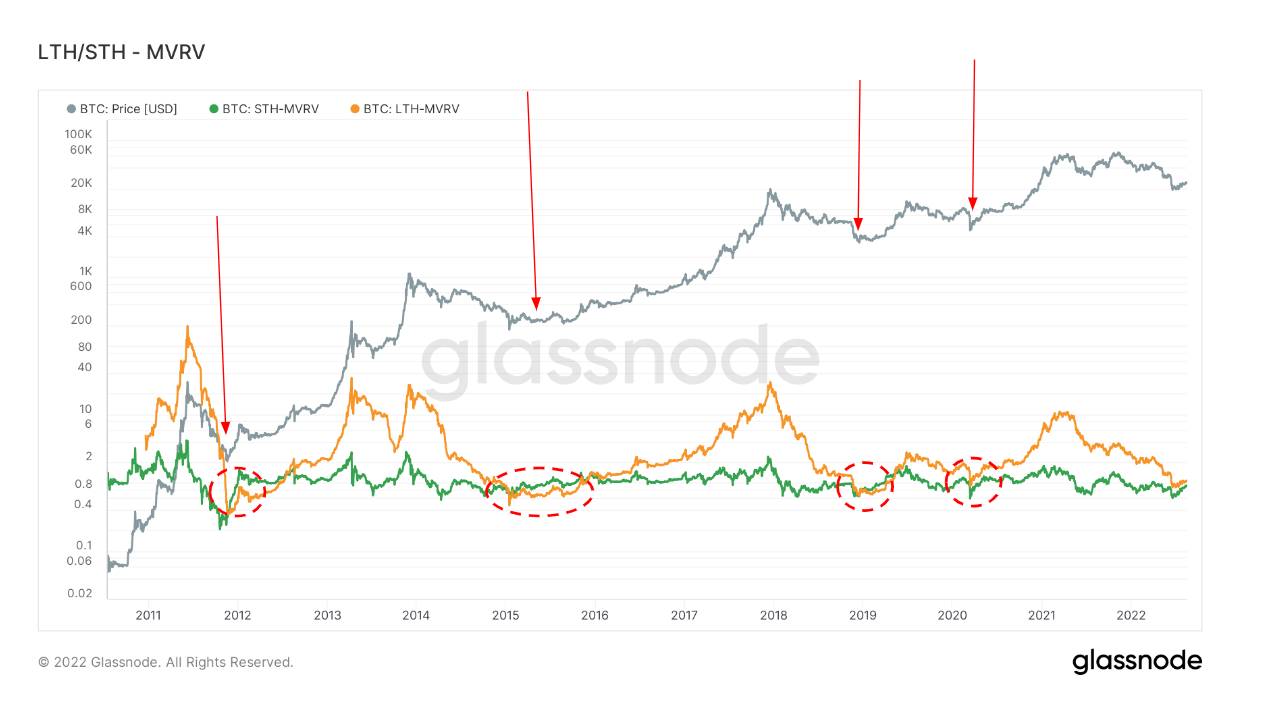
Market Value to Realized Value
Market Value to Realized Value (MVRV) refers to the ratio between the market cap (or market value) and realized cap (or the value stored). By collating this information, MVRV indicates when the Bitcoin price is trading above or below “fair value.”
At the same time, by comparing long-term and short-term MVRV, it is possible to gauge the capitulation of long-term holders.
Long-term Holder MVRV (LTH-MVRV) considers only unspent transaction outputs with a lifespan of at least 155 days. It serves as an indicator to assess the behavior of long-term investors.
The past four cycle bottoms were characterized by a convergence of the STH-MVRV and LTH-MVRV lines. Such an intersection has yet to occur, suggesting long-term holders have to capitulate in relation to short-term holders.
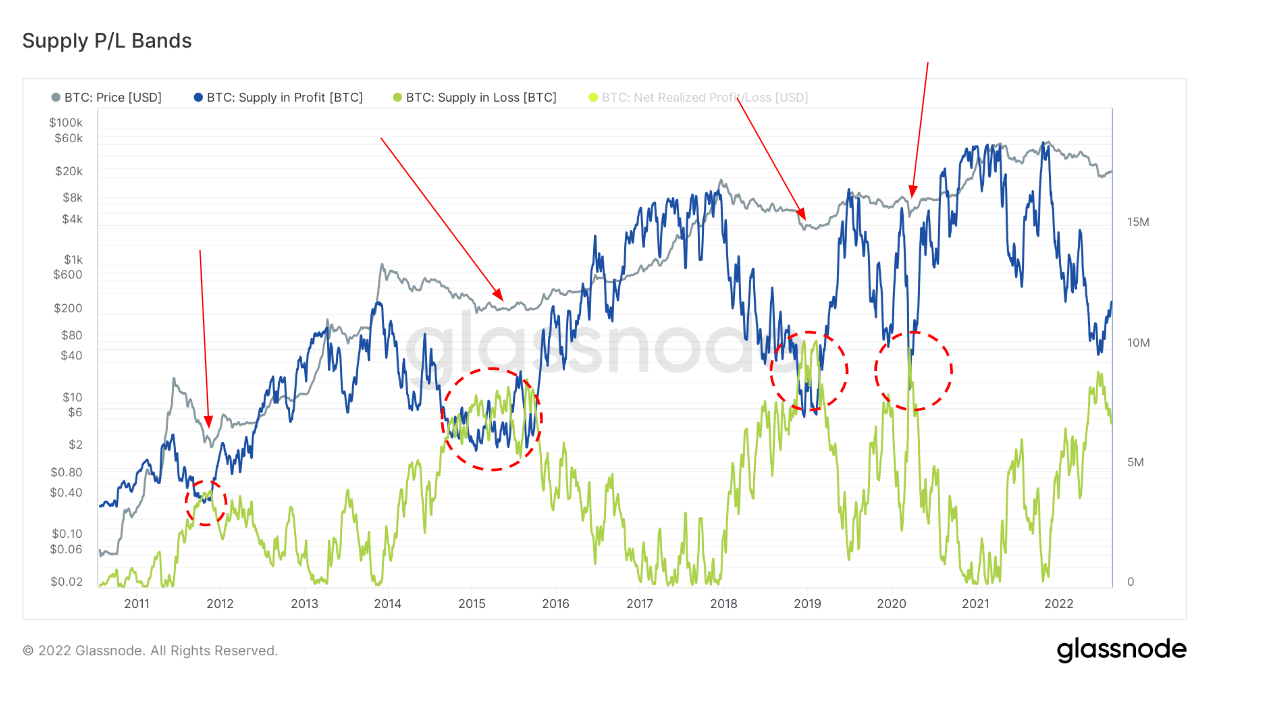
Supply in profit/loss
Supply in Profit and Loss (SPL) examines the circulating supply in profit and loss. In other words, it looks at the number of tokens whose price was lower or higher than the current price when they last moved.
Similar to the previous two examples, previous cycle bottoms were in when the profit and loss lines converged. Currently, the profit line is yet to converge against the loss line.
- analysis
- Bitcoin
- blockchain
- blockchain compliance
- blockchain conference
- coinbase
- coingenius
- Consensus
- crypto conference
- crypto mining
- cryptocurrency
- CryptoSlate
- decentralized
- DeFi
- Digital Assets
- ethereum
- machine learning
- non fungible token
- plato
- plato ai
- Plato Data Intelligence
- Platoblockchain
- PlatoData
- platogaming
- Polygon
- proof of stake
- research
- W3
- zephyrnet