Published 4 hours ago
The Ethereum price shows the formation of a rounding bottom pattern in the daily time frame chart. Under the influence of this pattern and ongoing recovery sentiment in the broader market, the prices witnessed 30% growth over the past two weeks. However, the buyers currently struggling at $1650 resistance show signs of bearish reversal. Should you keep holding?
advertisement
Key points:
- A rounding bottom pattern governs the Ethereum price action.
- The rising 20-and-50-day EMA shows signs of bullish recovery.
- The intraday trading volume in Ethereum is $14.5 Billion, indicating a gain of 32.6%.
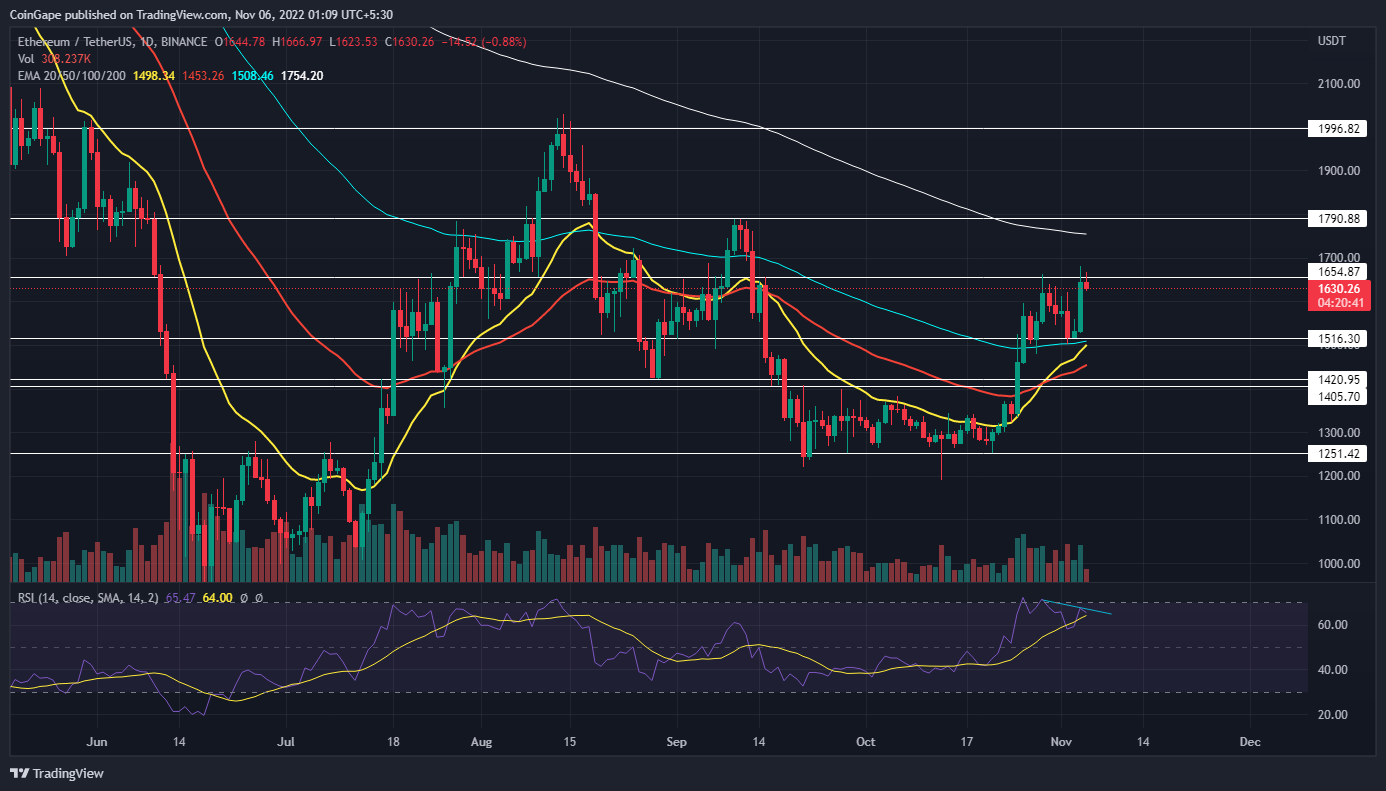
Source- Tradingview
The parabolic recovery in late October pushed the Ethereum price to the $1655 mark. However, amid the release of a 75 bps interest hike from the US Fed, the altcoin witnessed a minor pullback to $1500.
Nevertheless, the prices recovered immediately and tried to surpass the $1655 barrier. However, the higher price rejection at this resistance indicates the sellers continue to defend this mark.
Trending Stories
Also read- Top 7 Ethereum Tokens You Should Buy in November 2022; Here’s List,
Today, the Ethereum price trades at $1627, with an intraday loss of 1.04%. If the selling pressure persists, the altcoin could plunge 7% to retest the $1500 support. Moreover, this possible bearish reversal may reveal the formation of a double-top pattern.
This bearish pattern could accelerate the selling pressure and break the $1500 support for prolonged correction.
On a contrary note, with the recovery sentiment in the crypto market continuing to develop, the buyers could reattempt a $1500 breakout. A daily candle closing above this resistance will undermine the bearish thesis and indicates the resumption of the prevailing uptrend,
Technical indicator-
EMAs: the 20-and-100-day EMA accumulated at the $1500 mark, increasing the supporting strength of this level. Moreover, a bullish divergence between these slopes would attract more buyers to the market.
advertisement
RSI: A bearish divergence in the daily-RSI slope as it retests the $1650 resistance indicates a weakening of bullish commitment. This divergence bolsters the formation of the aforementioned bearish pattern.
Ethereum intraday price levels
- Spot price: $1630
- Trend: bearish
- Volatility: Low
- Resistance level- $1655 and $1800
- Support level- $1500 and $142
Share this article on:
The presented content may include the personal opinion of the author and is subject to market condition. Do your market research before investing in cryptocurrencies. The author or the publication does not hold any responsibility for your personal financial loss.
- Bitcoin
- blockchain
- blockchain compliance
- blockchain conference
- coinbase
- Coingape
- coingenius
- Consensus
- crypto conference
- crypto mining
- cryptocurrency
- decentralized
- DeFi
- Digital Assets
- ethereum
- Ethereum Price Analsysis
- machine learning
- non fungible token
- plato
- plato ai
- Plato Data Intelligence
- Platoblockchain
- PlatoData
- platogaming
- Polygon
- Price Analysis
- proof of stake
- W3
- zephyrnet