Published 10 hours ago
SHIB Price Prediction: For over a week, the Shiba Inu price has been hovering above the monthly support of $0.00000996, indicating an indecisive sentiment in the market. However, this support is also the lower band of a bearish flag pattern indicating this memecoin is poised for a prolonged downfall. Here’s how this pattern may affect the future trend of the Shiba Inu coin.
advertisement
Key Points:
- In theory, the bearish flag is a downtrend continuation pattern that offers a short break before the price continues to fall further
- The Shiba Inu price escape from the consolidation phase will determine this future trend.
- The intraday trading volume of the Shiba Inu coin is $104.5 Million, showing a 10% gain.
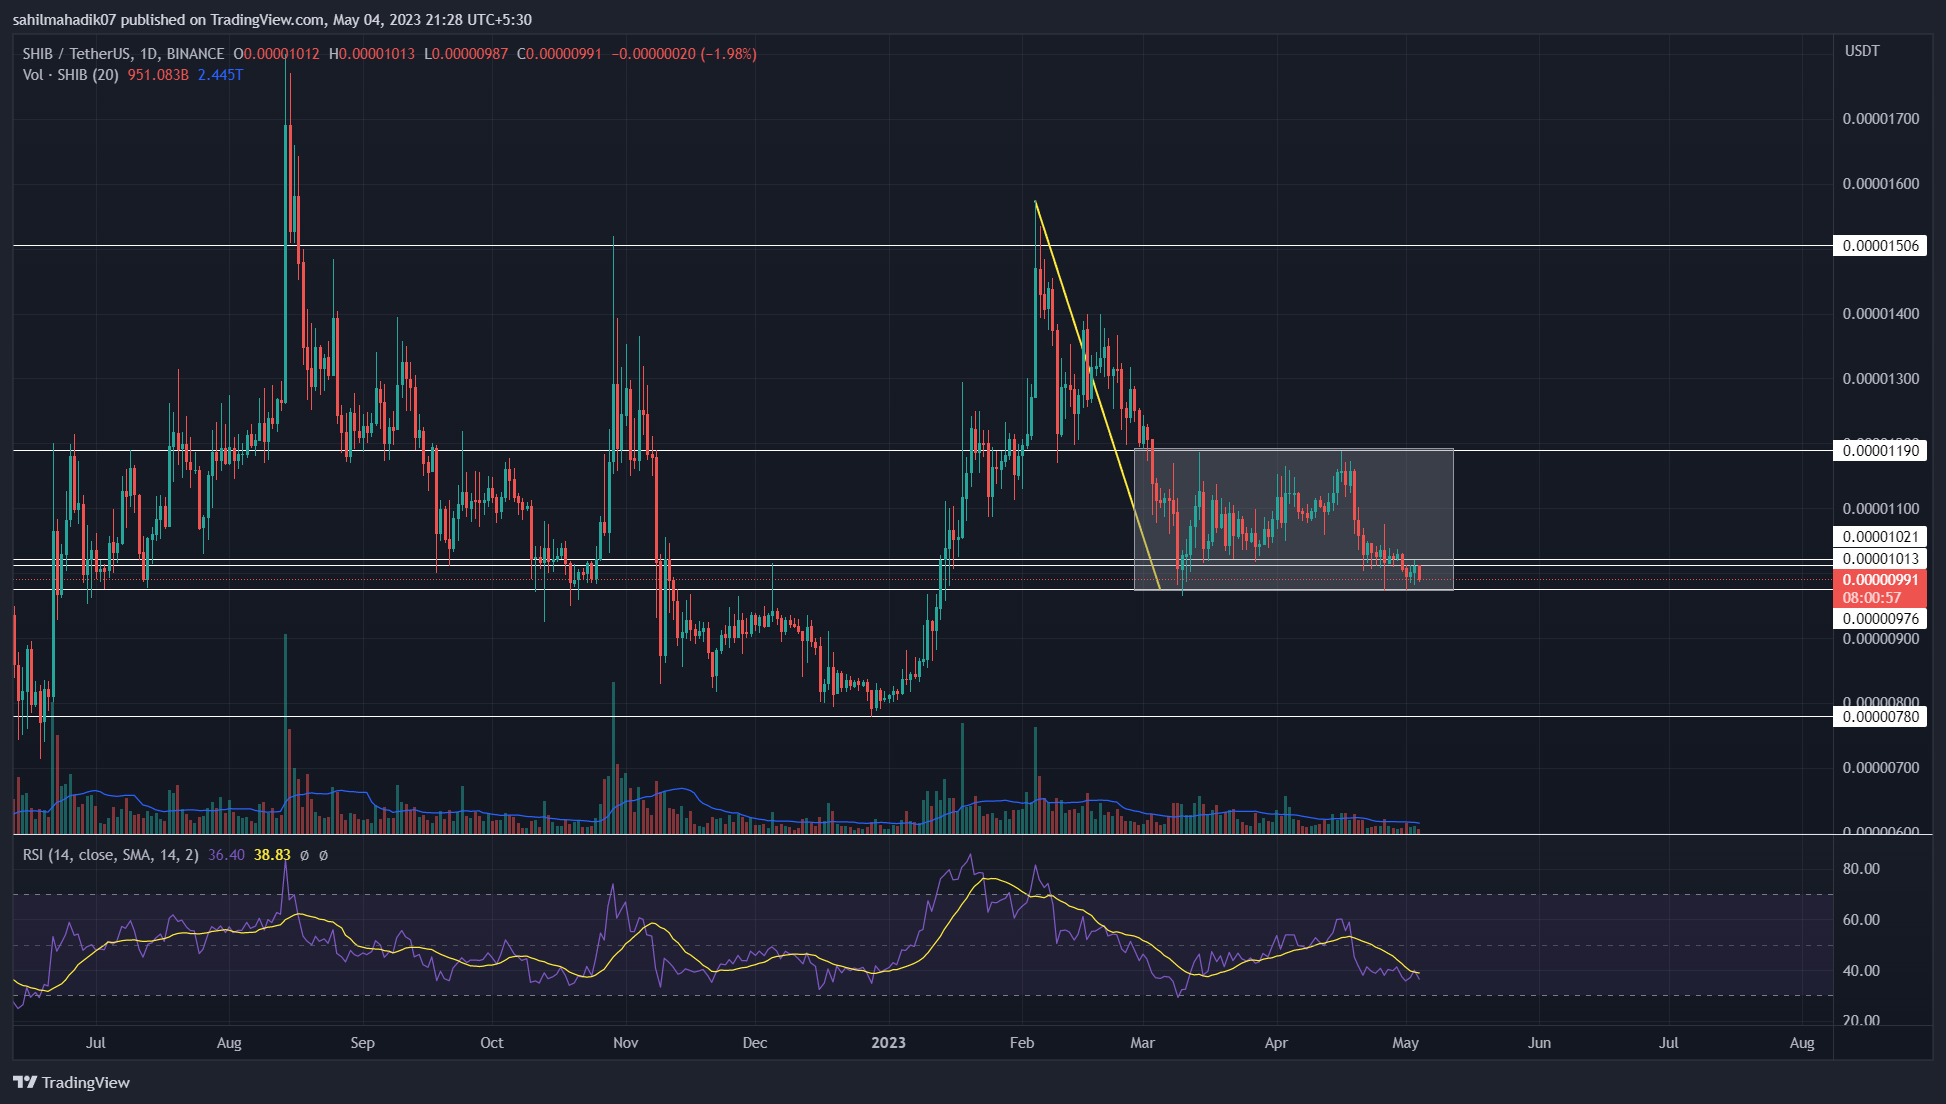
Source- Tradingview
Considering the aggressive fall in the Feb to Early March, the last two months’ consolidation in the daily time frame chart shows the formation of an inverted flag pattern. Under the influence of this pattern, this consolidation phase is temporary and the sellers are likely to intensify supply pressure once the price breached the flag’s range support.
By the press time, the Shiba Inu price trades at $0.00000994, with an intraday loss of 1.58%. If the daily price pierced below the $0.00000996 support with a candle closing the accelerated selling pressure may tumble the prices 20% down to hit the 4-hour month low of $0.0000078.
Trending Stories
The daily candles showing lower price rejection indicate the possibility of a bullish reversal which may prolong the sideways trend. Thus, if the buyer continues to defend this support, an upside breakout above $0.0000102 will trigger a bull cycle within the pattern and surge the prices $25% higher to hit $0.0000119.
Technical indicator
Relative Strength Index: Despite a sideways action above $0.00000996 support, the 4-hour RSI slope rising higher increases the possibility of a bullish reversal.
Exponential Moving Average: the daily EMAs(20, 50, 100, and 200) wavering above the current market price indicated the traders would face the least resistance in a downward trend.
Shiba Inu Price Intraday Levels
- Spot price: $0.0000991
- Trend: Bearish
- Volatility: High
- Resistance levels- $0.0000107 and $0.0000117
- Support levels: $0.00001 and $0.00000875
Share this article on:
advertisement
The presented content may include the personal opinion of the author and is subject to market condition. Do your market research before investing in cryptocurrencies. The author or the publication does not hold any responsibility for your personal financial loss.
<!– Close Story–>
- SEO Powered Content & PR Distribution. Get Amplified Today.
- PlatoAiStream. Web3 Data Intelligence. Knowledge Amplified. Access Here.
- Minting the Future w Adryenn Ashley. Access Here.
- Buy and Sell Shares in PRE-IPO Companies with PREIPO®. Access Here.
- Source: https://coingape.com/markets/shib-price-prediction-these-levels-determine-if-shiba-inu-price-rally-25-fall-20/
- :has
- :is
- :not
- 1
- 10
- 100
- 12
- 14
- 20
- 200
- 50
- 7
- 8
- 9
- a
- above
- accelerated
- Action
- Ad
- affect
- aggressive
- ago
- also
- am
- an
- and
- any
- ARE
- article
- At
- author
- avatar
- average
- BAND
- banner
- bearish
- Beauty
- been
- before
- below
- blockchain
- Break
- breakout
- Brian
- bull
- Bullish
- CAN
- Candles
- cap
- Chart
- closing
- Coin
- Coingape
- COM
- condition
- consolidation
- content
- continuation
- continues
- crucial
- crypto
- cryptocurrencies
- cryptocurrency
- Current
- cycle
- daily
- Despite
- Determine
- different
- do
- does
- down
- downfall
- downward
- Early
- Entertainment
- escape
- Ether (ETH)
- Face
- Fall
- Fashion
- Feb
- finance
- financial
- follow
- For
- formation
- FRAME
- from
- future
- Gain
- Have
- higher
- Hit
- hold
- HOURS
- How
- However
- HTTPS
- i
- if
- in
- include
- Including
- Increases
- index
- indicate
- indicated
- influence
- Inu
- investing
- journalism
- jpg
- Last
- least
- levels
- likely
- loss
- Low
- March
- Market
- market research
- May..
- Memecoin
- million
- Month
- monthly
- moving
- moving average
- of
- Offers
- on
- once
- Opinion
- or
- out
- over
- past
- Pattern
- personal
- phase
- plato
- Plato Data Intelligence
- PlatoData
- plugin
- points
- poised
- possibility
- prediction
- presented
- press
- pressure
- price
- Price Prediction
- Prices
- Publication
- rally
- range
- reach
- Read
- research
- Resistance
- responsibility
- Reversal
- rising
- Sellers
- Selling
- sentiment
- Share
- SHIB
- SHIB Price
- Shiba
- Shiba Inu
- Shiba Inu Coin
- Shiba Inu Price
- Short
- Shows
- sideways
- strength
- subject
- supply
- support
- surge
- temporary
- that
- The
- The Future
- These
- this
- time
- to
- Topics
- Traders
- trades
- Trading
- trading volume
- TradingView
- Trend
- trending
- trigger
- two
- under
- Upside
- variety
- volume
- week
- which
- will
- with
- within
- working
- would
- written
- years
- Your
- zephyrnet