Published 18 seconds ago
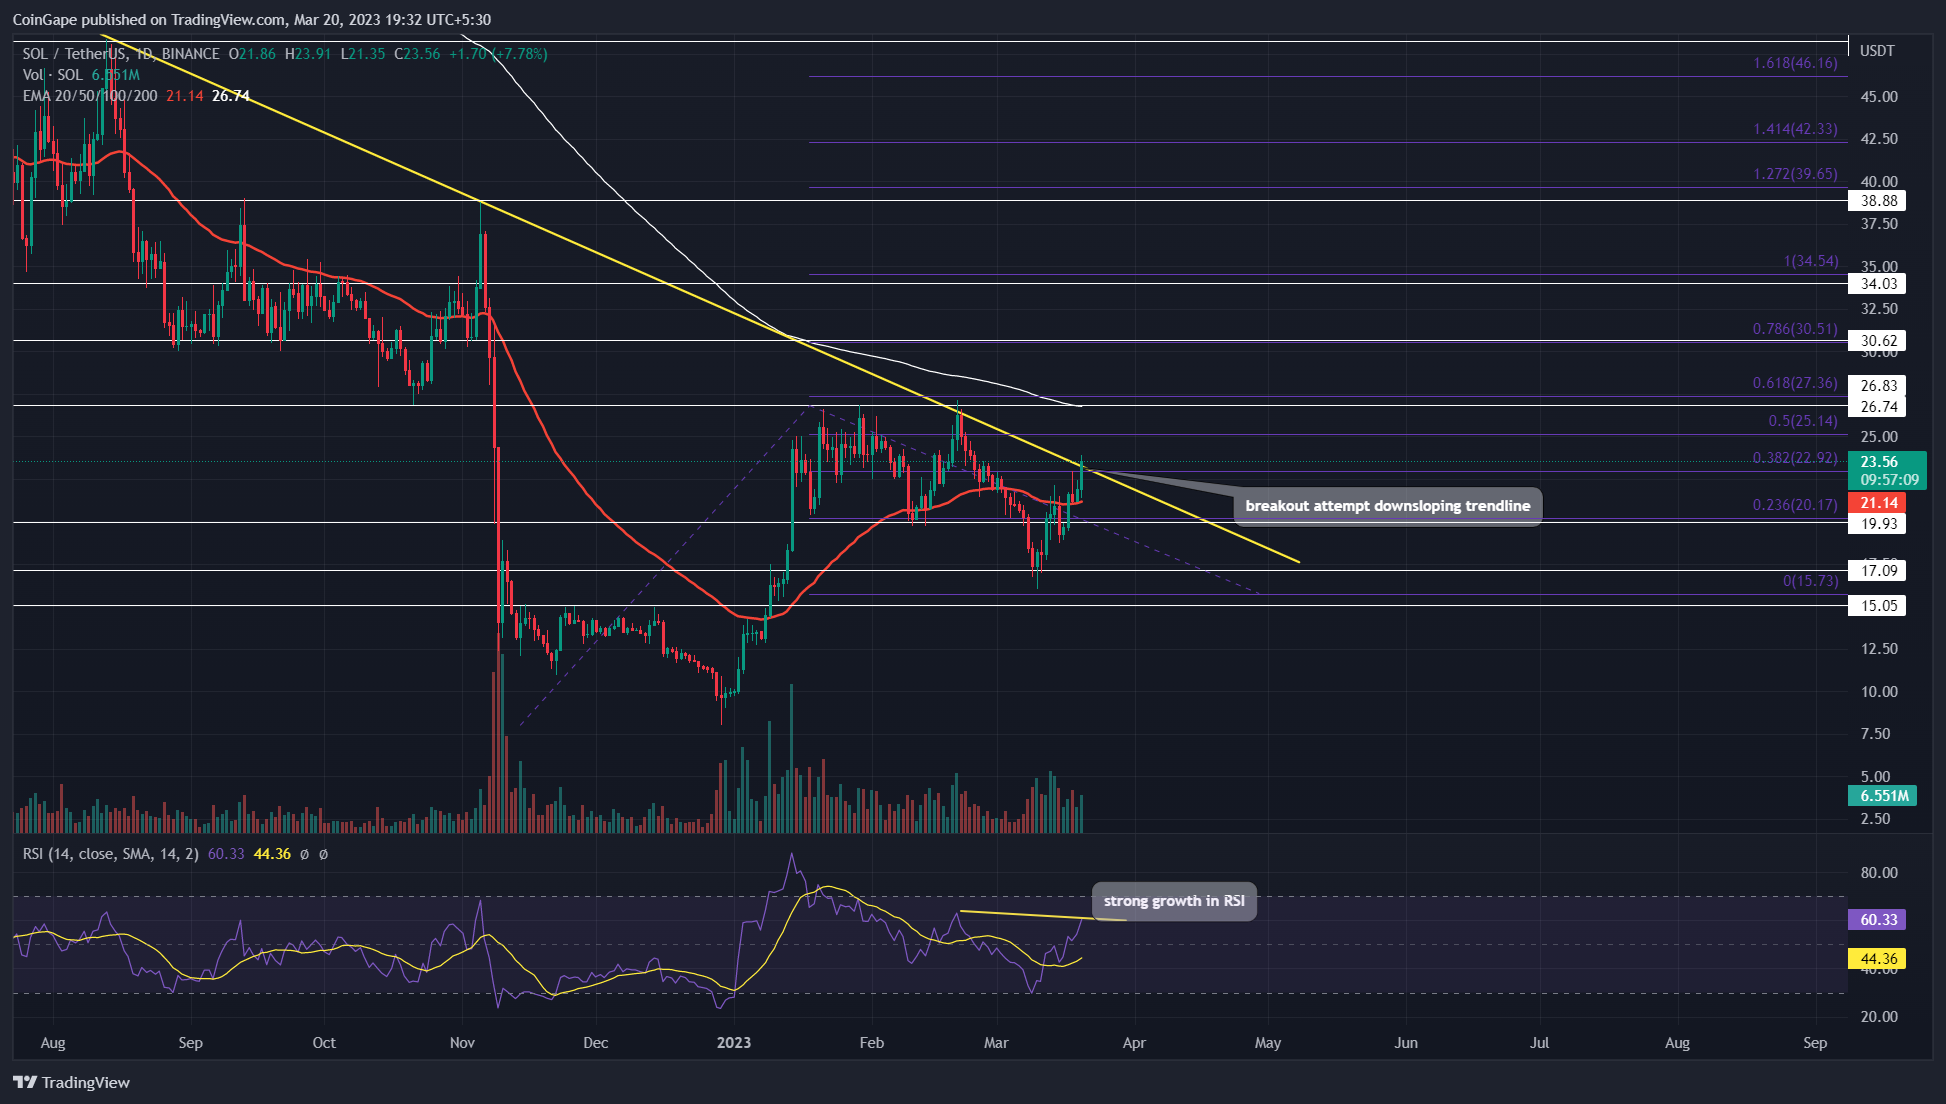
Over the past ten months, the Solana coin price has witnessed a steady downfall under the influence of a downsloping trendline Using this trendline the sellers have recuperated the selling momentum on bullish pullbacks which is a key trait of an established downtrend. Anyhow, with a 7% intraday jump, the buyers showcase a breakout attempt from this dynamic resistance projecting a possibility of a directional bull run ahead.
Key Points
- The Solana price will continue its ongoing downtrend until the resistance trendline is intact.
- A bullish breakout from the resistance trendline will be an early sign of trend reversal
- The 24-hour trading volume in the Solana coin is $1.04 Million, indicating a 114% gain.
Source-Tradingview
Amid the recent recovery in the crypto market, the Solana coin price shows a V-shaped recovery from the $17 support. Within a fortnight, The bullish reversal surged the prices by 37% where it currently trades at the $23.37 mark.
Trending Stories
With increasing buying pressure in the market, the SOL buyers showcase a breakout attempt from a long-coming resistance trendline. Over the past ten months, the coin price has shown several price reversals from this trendline, indicating traders are aggressively selling price rallies.
Also Read: Top 6 Liquid Staking Platforms On Ethereum
Thus, the aforementioned breakout indicates the buyer’s attempt to regain trend control. If the coin price gives a decisive breakout with the daily candle closing above the resistance trendline, the buyers will obtain strong support to prolong a bullish recovery.
As per the Fibonacci retracement level, the post-breakout rally could reach the potential target of $26.75 at 0.618 FIB, followed by $30.6 at 0.786FIB, or the 100% FIB mark near $34.
On a contrary note, if the daily candle closes below the downsloping trendline, the SOL price may enter a new correction phase.
Technical Indicator
RSI: despite an evident downtrend in price action, the recovering RSI slope has nearly reached its last swing high on February 20th, indicating an underlying growth in bullishness and an increasing possibility for a trendline breakout.
EMAs: The rising SOL price reclaimed the daily EMAs(20, 50, and 100), offering an additional edge in buyers’ favor.
Solana Coin Price Intraday Level
- Spot price: $23.25
- Trend: bullish
- Volatility: Medium
- Resistance levels: $25 and $26.75
- Support levels: $20 and $16
Share this article on:
advertisement
The presented content may include the personal opinion of the author and is subject to market condition. Do your market research before investing in cryptocurrencies. The author or the publication does not hold any responsibility for your personal financial loss.
<!– Close Story–>
- SEO Powered Content & PR Distribution. Get Amplified Today.
- Platoblockchain. Web3 Metaverse Intelligence. Knowledge Amplified. Access Here.
- Source: https://coingape.com/markets/solana-price-breakout-from-key-resistance-hints-a-potential-upswing-to-34-mark/
- :is
- 1
- 10
- 100
- 7
- 8
- 9
- a
- above
- Action
- Ad
- Additional
- ahead
- and
- ARE
- article
- At
- author
- avatar
- banner
- BE
- Beauty
- before
- below
- blockchain
- breakout
- Brian
- bull
- Bull Run
- Bullish
- buyers
- Buying
- by
- Closes
- closing
- Coin
- Coingape
- COM
- condition
- content
- continue
- contrary
- control
- correction phase
- could
- crypto
- Crypto Market
- cryptocurrencies
- cryptocurrency
- Currently
- daily
- decisive
- different
- downfall
- dynamic
- Early
- Edge
- Enter
- Entertainment
- established
- Ether (ETH)
- Fashion
- favor
- February
- finance
- financial
- follow
- followed
- For
- from
- Gain
- gives
- Growth
- Have
- High
- hints
- hold
- HTTPS
- i
- in
- include
- Including
- increasing
- indicates
- influence
- investing
- IT
- ITS
- journalism
- jpg
- jump
- Key
- key resistance
- Last
- levels
- Liquid
- liquid staking
- loss
- mark
- Market
- market research
- million
- Momentum
- months
- Near
- nearly
- New
- obtain
- of
- offering
- on
- ongoing
- Opinion
- past
- personal
- phase
- Platforms
- plato
- Plato Data Intelligence
- PlatoData
- plugin
- possibility
- potential
- presented
- pressure
- price
- PRICE ACTION
- Prices
- Publication
- rallies
- rally
- reach
- reached
- Read
- recent
- recovering
- recovery
- research
- Resistance
- responsibility
- retracement
- Reversal
- rising
- Run
- seconds
- Sellers
- Selling
- several
- Share
- showcase
- shown
- Shows
- sign
- SOL
- SOL Price
- Solana
- solana coin
- Solana Price
- Staking
- steady
- strong
- subject
- support
- Surged
- Target
- ten
- The
- to
- Topics
- Traders
- trades
- Trading
- trading volume
- TradingView
- Trend
- trending
- under
- underlying
- variety
- volume
- which
- will
- with
- within
- witnessed
- working
- written
- years
- Your
- zephyrnet