SNEAK PEEK:
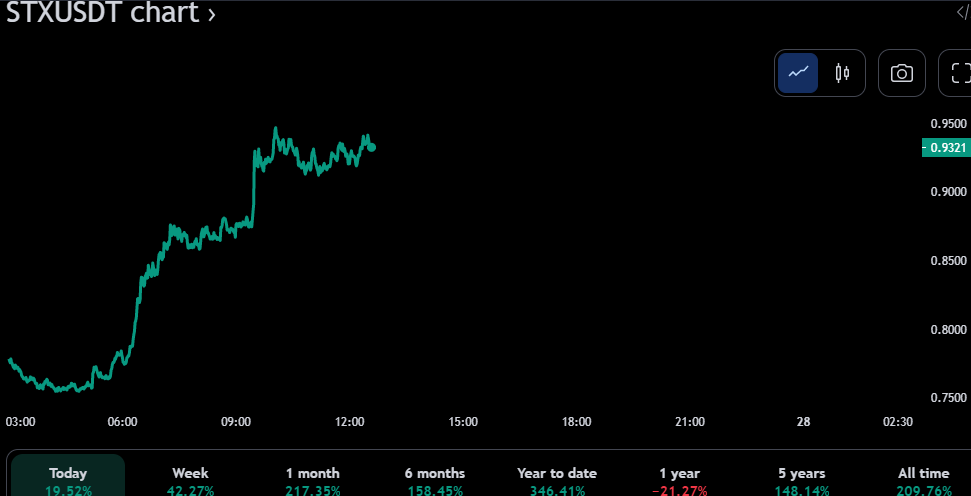
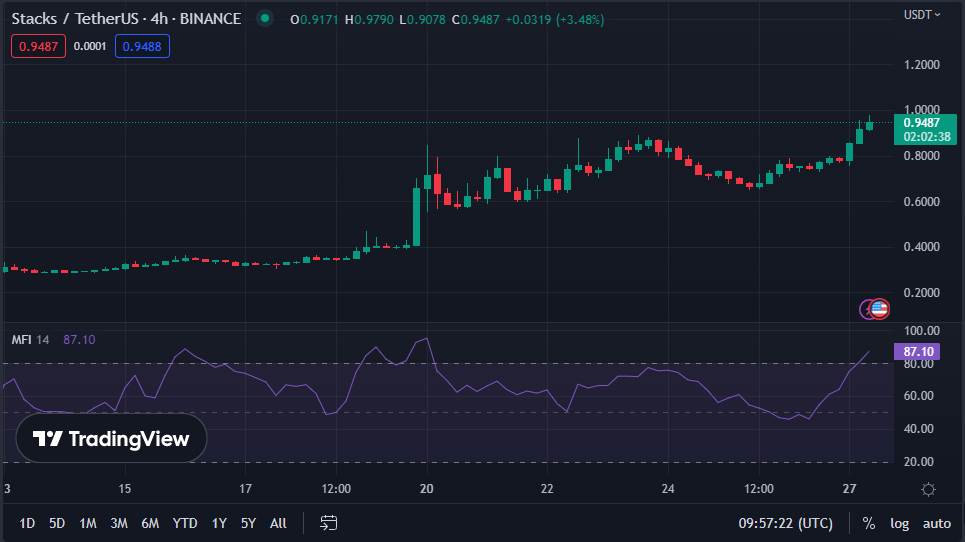
- STX experiences robust bullish dominance, reaching a 90-day high.
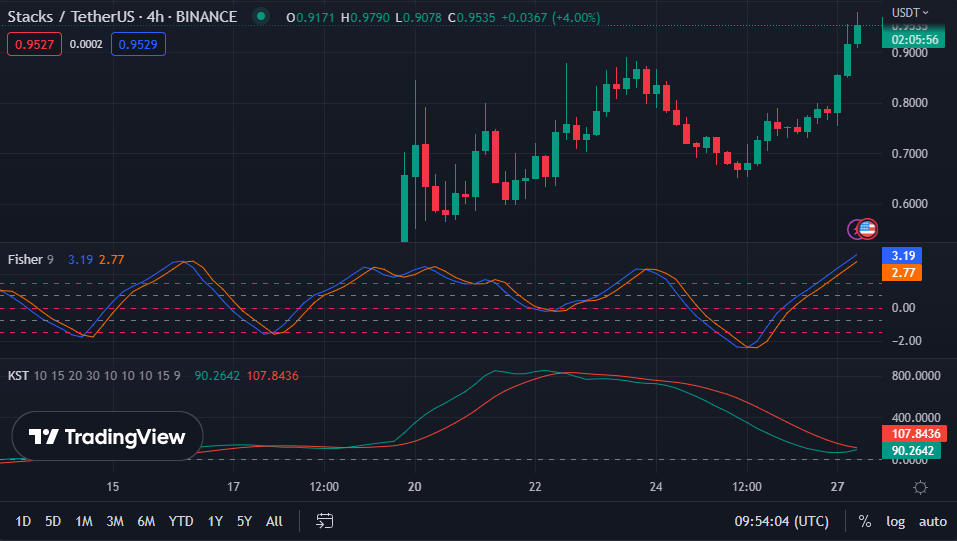
- Fisher Transform suggests a strong uptrend, promising short-term gains.
- Despite the potential short-term correction, STX remains a fantastic long-term investment opportunity.
In the previous 24 hours, Stacks’ (STX) market has experienced robust bullish dominance, with the price rising to a new 90-day high of $0.9435. The bullish dominance had persisted as of press time, with the price increasing 23.77% in the past hour to $0.9351. During the rally, negative efforts to lower costs were met with resistance at $0.732.
Consequently, the market capitalization and 24-hour trading volume increased by 23.89% and 45.98%, respectively, to $1,274,439,421 and $368,902,670. The bullish run may continue as buyers show no indications of slowing down in the short term, with market capitalization and 24-hour trading volume reaching fresh highs. Despite a few dips, the bullish rise has gained traction and will continue in the short term.
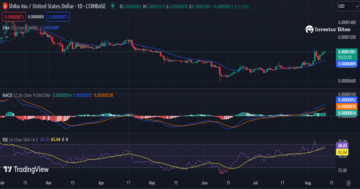
With a value of 3.19, the Fisher Transform indicator indicates that the STX market is in a strong uptrend, with the price expected to continue rising in the foreseeable future. This level suggests that STX is in a strong uptrend, with the Fisher Transform indicator climbing above its signal line, and the market is promising for short-term gains.
This increase indicates the market’s strong purchasing momentum, showing that investors believe in STX as a company and are prepared to take risks to invest in it.
Nevertheless, since the Know Sure Thing (KST) has lately moved below its signal line with a reading of 88.0831, the STX market may be in for a short-term correction, with prices potentially falling soon.
Although this is feasible, the Fisher Transform reading implies that such a correction would be short-lived and unlikely to result in long-term investor losses.
At 86.81, the Money Flow Index (MFI) indicates that STX’s recent uptrend is still going strong. This indicates that STX is still a fantastic long-term investment opportunity despite the possibility of a near-term slump.
In other words, although the KST may point to a temporary drop in prices, the other signs imply that this might be seen as a chance to buy rather than a reason for alarm, allowing investors to purchase shares at a cheaper price and perhaps reap a greater gain later on.
Despite the possibility of a short-term correction, STX’s strong bullish momentum, indicated by the Fisher Transform and MFI, presents an opportunity for long-term gains.
Disclaimer: In good faith, we disclose our thoughts and opinions in our price analysis, as well as all the facts we give. Each reader is responsible for his or her own investigation. Reader discretion is advised before taking any action.
- SEO Powered Content & PR Distribution. Get Amplified Today.
- Platoblockchain. Web3 Metaverse Intelligence. Knowledge Amplified. Access Here.
- Source: https://investorbites.com/stacks-price-analysis-27-2/
- a
- above
- Action
- alarm
- All
- Allowing
- Although
- analysis
- and
- before
- believe
- below
- Bullish
- buy
- buyers
- capitalization
- Chance
- Chart
- cheaper
- Climbing
- company
- continue
- Costs
- Despite
- Disclose
- discretion
- Dominance
- down
- Drop
- during
- each
- efforts
- expected
- experienced
- Experiences
- faith
- Falling
- fantastic
- feasible
- few
- flow
- foreseeable
- fresh
- future
- Gain
- Gains
- Give
- going
- good
- greater
- High
- Highs
- HOURS
- HTTPS
- important
- in
- Increase
- increased
- increasing
- index
- indicated
- indicates
- indications
- Indicator
- internal
- Invest
- investigation
- investment
- investor
- Investors
- IT
- Know
- Level
- Line
- long-term
- losses
- Market
- Market Capitalization
- Market News
- might
- Momentum
- money
- negative
- New
- news
- Opinions
- Opportunity
- Other
- own
- past
- perhaps
- plato
- Plato Data Intelligence
- PlatoData
- Point
- possibility
- potential
- potentially
- prepared
- presents
- press
- previous
- price
- Price Analysis
- price chart
- Prices
- promising
- purchase
- purchasing
- rally
- reaching
- Reader
- Reading
- reason
- recent
- remains
- Resistance
- responsible
- result
- Revealed
- Rise
- rising
- risks
- robust
- Run
- Shares
- Short
- short-term
- show
- Signal
- Signs
- since
- Slowing
- Slump
- Soars
- Soon
- Source
- stablecoin
- Stacks
- Still
- strong
- STX
- such
- Suggests
- Take
- taking
- temporary
- The
- thing
- time
- to
- traction
- Trading
- trading volume
- TradingView
- Transform
- uptrend
- value
- volume
- What
- What is
- will
- words
- would
- zephyrnet