Image by Author
As a Data Scientist, you will want to know the accuracy of your outcomes to ensure validity. The data science workflow is a planned project, with controlled conditions. Allowing you to assess each stage and how it lent towards your output.
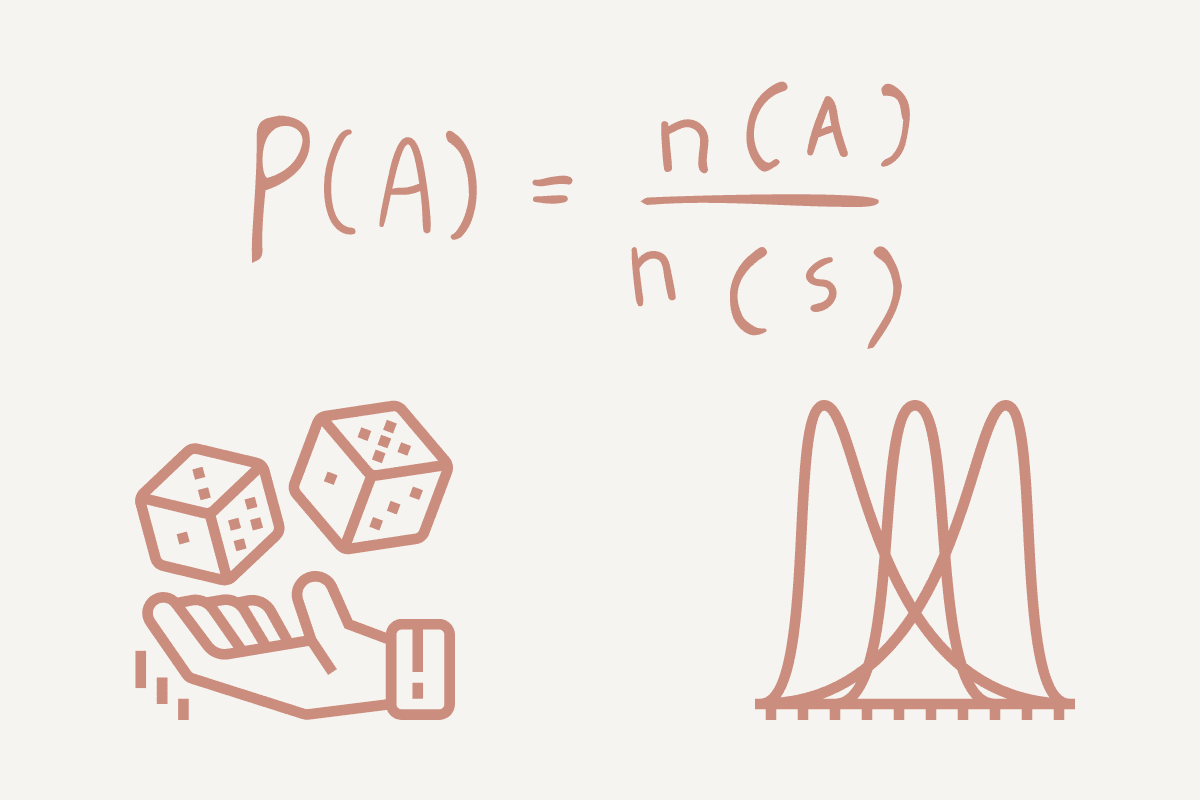
Probability is the measure of the likelihood of an event/something happening. It is an important element in predictive analysis allowing you to explore the computational math behind your outcome.
Using a simple example, let’s look at tossing a coin: either heads (H) or tails (T). Your probability will be the number of ways an event can occur divided by the total number of possible outcomes.
- If we want to find the probability of heads, it would be 1 (Head) / 2 (Heads and Tails) = 0.5.
- If we want to find the probability of tails, it would be 1 (Tails) / 2 (Heads and Tails) = 0.5.
But we don’t want to get likelihood and probability confused – there is a difference. Probability is the measure of a specific event or outcome occurring. Likelihood is applied when you want to increase the chances of a specific event or outcome occurring.
To break it down – probability is about possible results, whilst likelihood is about hypotheses.
Another term to know is ‘’mutually exclusive events’’. These are events that do not occur at the same time. For example, you cannot go right and left at the same time. Or if we’re flipping a coin, we can either get heads or tails, not both.
Types of Probability
- Theoretical Probability: this focuses on how likely an event is to occur and is based on the foundation of reasoning. Using theory, the outcome is the expected value. Using the head and tails example, the theoretical probability of landing on heads is 0.5 or 50%.
- Experimental Probability: this focuses on how frequently an event occurs during an experiment duration. Using the head and tails example – if we were to toss a coin 10 times and it landed on heads 6 times, the experimental probability of the coin landing on heads would be 6/10 or 60%.
Conditional probability is the possibility of an event/outcome occurring based on an existing event/outcome. For example, if you’re working for an insurance company, you may want to find the probability of a person being able to pay for his insurance based on the condition that they have taken out a house loan.
Conditional Probability helps Data Scientists produce more accurate models and outputs by using other variables in the dataset.
A probability distribution is a statistical function that helps to describe the possible values and probabilities for a random variable within a given range. The range will have possible minimum and maximum values, and where they are plotted on a distribution graph depend on statistical tests.
Depending on the type of data used in the project, you can figure out what type of distribution you are using. I will break them down into two categories: discrete distribution and continuous distribution.
Discrete Distribution
Discrete distribution is when the data can only take on certain values or has a limited number of outcomes. For example, if you were to roll a die, your limited values are 1, 2, 3, 4, 5, and 6.
There are different types of discrete distribution. For example:
- Discrete uniform distribution is when all the outcomes are equally likely. If we use the example of rolling a six-sided die, there is an equal probability that it can land on 1, 2, 3, 4, 5, or 6 – ⅙. However, the problem with discrete uniform distribution is that it does not provide us with relevant information, which data scientists can use and apply.
- Bernoulli Distribution is another type of discrete distribution, where the experiment only has two possible outcomes, either yes or no, 1 or 2, true or false. This can be used when flipping a coin, it is either head or tails. When using the Bernoulli distribution, we have the probability of one of the outcomes (p) and we can deduct it from the total probability (1), represented as (1-p).
- Binomial Distribution is a sequence of Bernoulli events and is the discrete probability distribution that can only produce two possible results in an experiment, either success or failure. When flipping a coin, the probability of flipping a coin will always be 1.5 or ½ in every experiment conducted.
- Poisson Distribution is the distribution of how many times an event is likely to occur over a specified period or distance. Rather than focusing on an event occurring, it focuses on the frequency of an event occurring in a specific interval. For example, if 12 cars go down a particular road at 11 am every day, we can use Poisson distribution to figure out how many cars go down that road at 11 am in a month.
Continuous Distribution
Unlike discrete distributions which have finite outcomes, continuous distributions have continuum outcomes. These distributions typically appear as a curve or a line on a graph as the data is continuous.
- Normal Distribution is one that you may have heard of as it is the most frequently used. It is a symmetrical distribution of the values around the mean, with no skew. The data follows a bell shape when plotted, where the middle range is the mean. For example, characteristics such as height, and IQ scores follow a normal distribution.
- T-Distribution is a type of continuous distribution used when the population standard deviation (σ) is unknown and the sample size is small (n<30). It follows the same shape as a normal distribution, the bell curve. For example, if we’re looking at how many chocolate bars were sold in a day, we would use the normal distribution. However, if we want to look into how many were sold in a specific hour, we will use t-distribution.
- Exponential distribution is a type of continuous probability distribution that focuses on the amount of time till an event occurs. For example, we may want to look into earthquakes and can use exponential distribution. The amount of time, starting from this point until an earthquake occurs. The exponential distribution is plotted as a curved line and represents the probabilities exponentially.
From the above, you can see how data scientists can use probability to understand more about data and answer questions. It is very useful for data scientists to know and understand the chances of an event occurring and can be very effective in the decision-making process.
You will be constantly working with data and you need to learn more about it before performing any form of analysis. Looking at the data distribution can give you a lot of information and can use this to adjust your task, process and model to cater to the data distribution.
This reduces your time spent understanding the data, provides a more effective workflow, and produces more accurate outputs.
A lot of the concepts of data science are based on the fundamentals of probability.
Nisha Arya is a Data Scientist and Freelance Technical Writer. She is particularly interested in providing Data Science career advice or tutorials and theory based knowledge around Data Science. She also wishes to explore the different ways Artificial Intelligence is/can benefit the longevity of human life. A keen learner, seeking to broaden her tech knowledge and writing skills, whilst helping guide others.
- SEO Powered Content & PR Distribution. Get Amplified Today.
- Platoblockchain. Web3 Metaverse Intelligence. Knowledge Amplified. Access Here.
- Source: https://www.kdnuggets.com/2023/02/importance-probability-data-science.html?utm_source=rss&utm_medium=rss&utm_campaign=the-importance-of-probability-in-data-science
- 1
- 10
- 11
- a
- Able
- About
- about IT
- above
- accuracy
- accurate
- advice
- All
- Allowing
- always
- amount
- analysis
- and
- Another
- answer
- appear
- applied
- Apply
- around
- artificial
- artificial intelligence
- bars
- based
- before
- behind
- being
- Bell
- benefit
- Break
- broaden
- cannot
- Career
- cars
- categories
- certain
- chances
- characteristics
- Chocolate
- Coin
- company
- concepts
- condition
- conditions
- confused
- constantly
- continuous
- Continuum
- controlled
- curve
- data
- data science
- data scientist
- day
- Decision Making
- describe
- deviation
- Die
- difference
- different
- distance
- distribution
- distributions
- divided
- Dont
- down
- during
- each
- Earthquake
- Effective
- either
- ensure
- equally
- Event
- events
- Every
- every day
- example
- Exclusive
- existing
- expected
- experiment
- explore
- exponential
- exponentially
- Failure
- Figure
- Find
- focuses
- focusing
- follow
- follows
- form
- Foundation
- freelance
- Frequency
- frequently
- from
- function
- Fundamentals
- get
- Give
- given
- Go
- graph
- guide
- Happening
- head
- heads
- heard
- height
- helping
- helps
- House
- How
- However
- HTTPS
- human
- importance
- important
- in
- Increase
- information
- insurance
- Intelligence
- interested
- IT
- KDnuggets
- Keen
- Know
- knowledge
- Land
- landing
- LEARN
- learner
- Life
- likely
- Limited
- Line
- loan
- longevity
- Look
- looking
- Lot
- many
- math
- maximum
- measure
- Middle
- minimum
- model
- models
- Month
- more
- most
- Need
- normal
- number
- ONE
- Other
- Others
- Outcome
- particular
- particularly
- Pay
- performing
- period
- person
- planned
- plato
- Plato Data Intelligence
- PlatoData
- Point
- population
- possibility
- possible
- Predictive Analysis
- probability
- Problem
- process
- produce
- project
- provide
- provides
- providing
- Questions
- random
- range
- reduces
- relevant
- represented
- represents
- Results
- road
- Roll
- Rolling
- same
- Science
- Scientist
- scientists
- seeking
- Sequence
- Shape
- Simple
- Size
- skew
- skills
- small
- sold
- specific
- specified
- spent
- Stage
- standard
- Starting
- statistical
- success
- such
- Take
- Task
- tech
- Technical
- tests
- The
- theoretical
- time
- times
- to
- toss
- Total
- towards
- true
- tutorials
- types
- typically
- understand
- understanding
- us
- use
- validity
- value
- Values
- variables
- ways
- What
- which
- Whilst
- will
- wishes
- within
- workflow
- working
- would
- writer
- writing
- Your
- zephyrnet