Macro Overview
Fed scores a hat-trick
The fed delivered its third consecutive 75 basis point hike accompanied by higher forecasts of future rates, pushing the dollar index and fixed income yields to new highs. Volatility across all asset classes had picked up, which had seen the ten-year minus two-year yields eventually close the widest since the year 1988.
The FOMC’s 75bps hike took the target range from 3% to 3.25%, with forecasts for the benchmark projected to reach the end of 2022 at 4.4%. Unemployment for 2023 increased to 4.4% from 3.9%, with rate hikes expected to cool the labor market.
As a result, the Euro hit its lowest point since 2002 vs. USD (0.96). The pound dropped to 1.08, and USDJPY had smashed through 145, with 10- year Japanese government bonds still hitting 0.25%.

Weimar Republic II
German August Producer Prices Index (PPI) surged 45.8% (vs. 37.1% expected) from a year ago. This was driven mainly by soaring energy prices, raising chances of higher CPI inflation in the next reading.
Concerning energy, PPI rose almost 15% compared to August 2021; however, energy prices were twice as high as in the same period last year, an increase of 139%. This would be why energy prices are not considered in the CPI print, as central banks would have to increase interest rates aggressively.

Germans have bad memories of hyperinflation as it affected the German Papiermark, the currency of the Weimar Republic, in the early 1920s. To pay for the reparations of WW1, Germany suspended the gold standard (convertibility of its currency to gold). The Germans used to pay war reparations by mass printing bank notes to buy foreign currency to pay for the reparations, which led to greater and greater inflation.
“A loaf of bread in Berlin that cost around 160 Marks at the end of 1922 cost 200,000,000,000 Marks by late 1923”- History Daily
The gold price in Weimar Marks in 1914 equaled 1, as golds supply increased only around 2% a year, a relatively stable asset. However, within the next decade, the percentage change in gold price fluctuated because the denominator (Weimar Marks) increased drastically in the money supply.
A similar situation occurred in the 2020s, as Bitcoin has similar characteristics to gold. Bitcoin is volatile in nature but also exasperated due to the increase in M2 money supply (consisting of M1 plus savings deposits).


Correlations
Manipulation of currency
The Bank of Japan left its policy rate unchanged at negative 0.1% and committed to keeping the ten-year treasury to 0.25%, sending the yen to a 24-year low against the dollar.
However, on Sept 22, Japan’s top currency diplomat Kanda confirmed they intervened in the FX market. The Japanese government stepped into the market to buy yen for dollars and conducted the first FX intervention since June 1998. The yen soared against the DXY, dropping from 145 to 142.
“If you manipulate the key aspect of money, you manipulate all of our time. And when you have manipulation in money, you have, you MUST have misinformation everywhere in society… Bitcoin is the opposite system. Hope, truth, better future. Spend time there.” – Jeff Booth.

Equities & Volatility Gauge
The Standard and Poor’s 500, or simply the S&P 500, is a stock market index tracking the stock performance of 500 large companies listed on exchanges in the United States. S&P 500 3,693 -4.51% (5D)
The Nasdaq Stock Market is an American stock exchange based in New York City. It is ranked second on the list of stock exchanges by market capitalization of shares traded, behind the New York Stock Exchange. NASDAQ 11,311 -4.43% (5D)
The Cboe Volatility Index, or VIX, is a real-time market index representing the market’s expectations for volatility over the coming 30 days. Investors use the VIX to measure the level of risk, fear, or stress in the market when making investment decisions. VIX 30 8.37% (5D)
Equities continue to plunge
Equities tried to put on a brave face but continued to get battered by rising interest rates. So far, in 2022, equity markets have been downgraded massively in valuations. With the end of the quarter and quarterly earnings season approaching, expect downgrades in earnings to continue this onslaught.
As supply chains continue to break down, the cost of capital increases, and a surging DXY are all liabilities for public companies. Expect to see the unemployment rate start to spike from Q4 onwards.

Commodities
The demand for gold is determined by the amount of gold in the central bank reserves, the value of the U.S. dollar, and the desire to hold gold as a hedge against inflation and currency devaluation, all help drive the price of the precious metal. Gold Price $1,644 -2.00% (5D)
Similar to most commodities, the silver price is determined by speculation and supply and demand. It is also affected by market conditions (large traders or investors and short selling), industrial, commercial, and consumer demand, hedge against financial stress, and gold prices. Silver Price $-4 -3.64% (5D)
The price of oil, or the oil price, generally refers to the spot price of a barrel (159 litres) of benchmark crude oil. Crude Oil Price $79 -7.56% (5D)
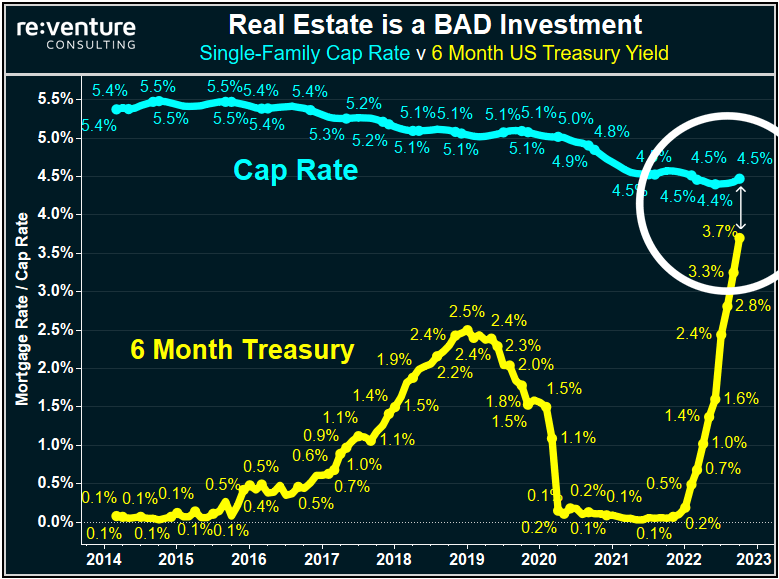
Don’t get left holding the real estate bag
The average fixed 30-year mortgage rate has accelerated by +104.5% on a year-over-year basis. This appears to be the fastest change rate since the data was collected in 1972.
The current 30-year fixed mortgage on Sept. 21 was 6.47% highest since 2008; it was just 2.86% in September 2020.
September 2020: a median home price of $337k with a 30-year mortgage rate of 2.86% would see a total paid over 30 years of $502k.
However, compared to September 2022: a median home price of $440k with a 30-year mortgage rate of 6.47% would see a total paid over 30 years of $998k.

Problems continue to pile up for real estate investors. The single-family cap rate vs. six-month US treasury yield identifies why real estate is a liability with rising interest rates. The 6-Month US Treasury now yields almost the same, if not more, in certain states as buying & renting out a house in America (aka Cap Rate).
Real estate has less incentive for investors to be in these markets due to prices going down. The next apparent sign is reduced investor demand and margin calls to sell properties and get the asset off the books. Each time the federal reserve increases interest rates, the capital cost increases on existing portfolios. A trend to follow is to see wall street and big banks looking to exit as quickly as possible, as they have already earned their fees.
Another indicator that signifies a darkening outlook for US homebuilders is the NAHB housing market index which came out on Sept. 19. The index fell for a ninth consecutive month and by more than expected in September. The index is threatening to sink to levels last seen during the housing crisis between 2006 and 2013, with activity in sales in the new homes market almost grinding to a halt.

Rates & Currency
The 10-year Treasury note is a debt obligation issued by the United States government with a maturity of 10 years upon initial issuance. A 10-year Treasury note pays interest at a fixed rate once every six months and pays the face value to the holder at maturity. 10Y Treasury Yield 3.68% 6.78% (5D)
The U.S. dollar index is a measure of the value of the U.S. dollar relative to a basket of foreign currencies. DXY 112.97 3.09% (5D)
60/40 portfolio is bleeding out
The 60/40 portfolio has served investors well for the past 40 years, with low inflation, volatility, and falling interest rates. The balanced portfolio would see 60% in equities and 40% in bonds.
Why was this strategy the ultimate insurance
- Strong risk: in an era of low-interest rates, the buy-and-hold strategy was perfect for equities. At the same time, bonds provided portfolio insurance during market stress, especially during the 2000 tech boom and GFC.
- Several disinflationary forces, such as globalization, the growth of China, and aging demographics and contained inflation.
Why it isn’t anymore
- Vulnerable to inflation: investors received reasonable nominal returns in the 1970s, but when you consider high inflation, portfolios lost a significant value. In an inflationary environment, bonds suffer more than equities; they will not protect the fundamental importance of portfolios.
- According to the CAPE ratio, bonds and equities were near all-time valuations. The ratio is calculated by dividing a company’s stock price by the average of the company’s earnings for the last ten years, adjusted for inflation. The current ratio is valued at around 29, coming down from levels of 35. The index is at similar levels to black Tuesday (1929 great depression) and significantly more elevated than the GFC.

A 60/40 portfolio of US stocks/bonds is down 16.2% in 2022, which is on pace for its worst calendar year since 1937.

Bitcoin Overview
The price of Bitcoin (BTC) in USD. Bitcoin Price $19,042 -2.58% (5D)
The measure of Bitcoin’s total market cap against the larger cryptocurrency market cap. Bitcoin Dominance 40.61% -1.82% (5D)

- Bitcoin has been ranging between the $18k and $20k range for the week commencing Sept. 19
- Addresses and gas fees are at multi-year lows.
- MicroStrategy purchased an additional 301 Bitcoins on Sept. 9; MicroStrategy now holds 130,000 Bitcoin.
- Miners’ revenue continues to get squeezed.
- BTC has been wrestling with the realized price since it went below it in mid-June

Addresses
Collection of core address metrics for the network.
The number of unique addresses that were active in the network either as a sender or receiver. Only addresses that were active in successful transactions are counted. Active Addresses 862,692 -9.54% (5D)
The number of unique addresses that appeared for the first time in a transaction of the native coin in the network. New Addresses 2,799,904 -4.16% (5D)
The number of unique addresses holding 1 BTC or less. Addresses with ≥ 1 BTC 904,423 0.24% (5D)
The number of unique addresses holding at least 1k BTC. Addresses with Balance ≤ 1k BTC 2,119 -0.7% (5D)
Ghost town
Active addresses are the number of unique addresses active in the network, either as a sender or receiver. Only addresses that were active in successful transactions are counted. Addresses are a great way to understand what activity is occurring on the network. Active addresses have been flat/muted for almost two years now, showing little activity on the network as speculators have left the ecosystem.
In addition, gas fees are meager and muted at levels seen almost since 2018. Fees will go up based on transactional activity, which also supports the case that it is a ghost town on the Bitcoin network.

Entities
Entity-adjusted metrics use proprietary clustering algorithms to provide a more precise estimate of the actual number of users in the network and measure their activity.
The number of unique entities that were active either as a sender or receiver. Entities are defined as a cluster of addresses that are controlled by the same network entity and are estimated through advanced heuristics and Glassnode’s proprietary clustering algorithms. Active Entities 273,390 -3.43% (5D)
The number of BTC in the Purpose Bitcoin ETF. Purpose ETF Holdings 23,613 0.04% (5D)
The number of unique entities holding at least 1k BTC. Number of Whales 1,698 -0.29% (5D)
The total amount of BTC held on OTC desk addresses. OTC Desk Holdings 2,153 BTC -46.59% (5D)
Whales continue to sell
The number of entities with a balance of 1,000 or more Bitcoin is considered a whale. During the peak of the early 2021 bull run, there were almost 2,500 whales as Bitcoin approached $60,000. However, as whales are considered the smart money of the Bitcoin ecosystem, they sold when the price was high; expect to see this cohort’s accumulation if Bitcoin trends lower in price.
The accumulation trend score by the cohort confirms the thesis above; the metric monitor’s distribution and accumulation by each entity’s wallet. The 1k-10k entity has started to increase its holdings since Sept. 19, signified by the dark blue, which is encouraging to see as they see Bitcoin as value for money at these price ranges.


Miners
Overview of essential miner metrics related to hashing power, revenue, and block production.
The average estimated number of hashes per second produced by the miners in the network. Hash Rate 230 TH/s 1.77% (5D)
The total supply held in miner addresses. Miner Balance 1,834,729 BTC -0.01% (5D)
The total amount of coins transferred from miners to exchange wallets. Only direct transfers are counted. Miner Net Position Change -17,692 BTC 21,838 BTC (5D)
Miners need to capitulate for the bottom to be confirmed
Looking back at the 2017-18 cycle, the final capitulation wasn’t until the miners capitulated. The Bitcoin hash rate fell over 30% from the peak as miners shut down due to being unprofitable. With rising energy bills and rates, something similar most likely occurs during the winter as the strain will intensify on unprofitable miners.
In addition, miner revenue per TeraHash (hash rate/ miner revenue) hasn’t broken down below its all-time lows, which has the potential to happen due to rising hash rate and BTC falling prices.
The mining industry is a game of survival of the fittest; any decent minor uses stranded energy and has a fixed PPA. As borrowing rates increase with energy prices, unprofitable miners will start to capitulate and fall off the network.


On-Chain Activity
Collection of on–chain metrics related to centralized exchange activity.
The total amount of coins held on exchange addresses. Exchange Balance 2,391,523 BTC 19,541 BTC (5D)
The 30 day change of the supply held in exchange wallets. Exchange Net Position Change 281,432 BTC 262,089 BTC (30D)
The total amount of coins transferred from exchange addresses. Exchange Outflows Volume 185,654 BTC -23 BTC (5D)
The total amount of coins transferred to exchange addresses. Exchange Inflows Volume 173,456 BTC -32 BTC (5D)
Bitcoin on-chain activity looks bleak
On-chain activity can determine how many coins are being spent to and from exchanges. The first metric contextualizes this, total transfer volume to exchanges. On Sept 19, 250k BTC was sent back onto exchanges which would be the highest amount since March 2020.
This is further supported by the metric exchange net position change, which shows inflows are the dominant regime. This has occurred only four times this year, both around the Russian invasion and the Luna collapse. A lot of bearish sentiment is being trickled through onto exchanges.

Supply
The total amount of circulating supply held by different cohorts.
The total amount of circulating supply held by long term holders. Long Term Holder Supply 13.65M BTC 0.29% (5D)
The total amount of circulating supply held by short term holders. Short Term Holder Supply 3.07M BTC -1.64% (5D)
The percent of circulating supply that has not moved in at least 1 year. Supply Last Active 1+ Year Ago 66% 0.08% (5D)
The total supply held by illiquid entities. The liquidity of an entity is defined as the ratio of cumulative outflows and cumulative inflows over the entity’s lifespan. An entity is considered to be illiquid / liquid / highly liquid if its liquidity L is ≲ 0.25 / 0.25 ≲ L ≲ 0.75 / 0.75 ≲ L, respectively. Illiquid Supply 14.8M BTC 0.01% (5D)
Follow the data
The total supply held by illiquid, liquid, and highly liquid entities. The liquidity of an entity is defined as the ratio of cumulative outflows and inflows over the entity’s lifespan. An entity is considered to be illiquid / liquid / highly liquid if its liquidity L is ≲ 0.25 / 0.25 ≲ L ≲ 0.75 / 0.75 ≲ L, respectively.
Bitcoin is closing in on 15 millionth bitcoin becoming illiquid; these are coins kept offline in hot or cold storage wallets. The circulating supply is around 19 million, with a staggering amount of the illiquid supply currently sitting at 79%.
This metric also breaks down the liquid and highly liquid supply. Since the beginning of the year, liquid and highly liquid BTC has decreased by around 400k BTC and become illiquid, which is bullish over the long term as fewer investors are speculating over the asset and holding it as a store of value.

Cohorts
Breaks down relative behavior by various entities’ wallet.
SOPR – The Spent Output Profit Ratio (SOPR) is computed by dividing the realized value (in USD) divided by the value at creation (USD) of a spent output. Or simply: price sold / price paid. Long-term Holder SOPR 0.57 -6.56% (5D)
Short Term Holder SOPR (STH-SOPR) is SOPR that takes into account only spent outputs younger than 155 days and serves as an indicator to assess the behaviour of short term investors. Short-term Holder SOPR 0.98 0.00% (5D)
The Accumulation Trend Score is an indicator that reflects the relative size of entities that are actively accumulating coins on-chain in terms of their BTC holdings. The scale of the Accumulation Trend Score represents both the size of the entities balance (their participation score), and the amount of new coins they have acquired/sold over the last month (their balance change score). An Accumulation Trend Score of closer to 1 indicates that on aggregate, larger entities (or a big part of the network) are accumulating, and a value closer to 0 indicates they are distributing or not accumulating. This provides insight into the balance size of market participants, and their accumulation behavior over the last month. Accumulation Trend Score 0.43 152.94% (5D)
Where are we in terms of cost-basis?
Realized price was the aggregate price when each coin was last spent on-chain. Further analyzing short and long-term holder cohorts, we can calculate the realized price to reflect the aggregate cost basis of each group.
This metric calculates the ratio between LTH and STH realized price:
- Uptrend when STHs realize a loss that is a greater rate than LTHs (e.g., accumulation in a bear market)
- Downtrend when LTHs spend coins and transfer them to STHs (e.g., bull market distribution)
During bear markets, as the price continues to fall, STH realized price will fall below LTH realized price. When capitulation occurs, highlighted by the purple zone, these events usually happen during late-stage bear markets.
The price has been in a downward spiral for almost a year, since November 2021, and we are yet to cross over; the expectation of this crossover could occur before the end of September. In previous bear market cycles, it usually takes on average 220 days to recover after the crossover.

- Bitcoin
- blockchain
- blockchain compliance
- blockchain conference
- coinbase
- coingenius
- Consensus
- crypto conference
- crypto mining
- cryptocurrency
- CryptoSlate
- decentralized
- DeFi
- Digital Assets
- ethereum
- machine learning
- non fungible token
- plato
- plato ai
- Plato Data Intelligence
- Platoblockchain
- PlatoData
- platogaming
- Polygon
- proof of stake
- W3
- zephyrnet