Disclaimer: The findings of the following analysis are the sole opinions of the writer and should not be taken as investment advice
A huge red candle on XRP’s chart identified losses of 19% in just a single day as the alt declined with the broader market. The candlewick even dropped to $0.95, marking XRP’s biggest percentage loss since 19 May. Moreover, a few of its indicators threatened to fall below crucial levels as a bearish trend became a real possibility.
At the time of writing, XRP was trading at $1.12, holding the seventh position on the crypto-rankings.
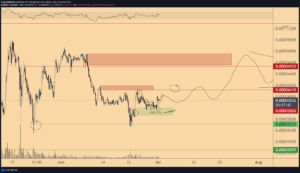
XRP Daily Chart

Source: XRP/USD, TradingView
A closer look at XRP’s chart indicated that near-term momentum favored the buyers as XRP dropped below its 20-SMA (red). Hence, the 61.8% Fibonacci Level ($1.07), which has held strong since 10 August, would be under tremendous pressure.
A breakdown would drag XRP towards the 50% and 38.2% Fibonacci levels. From the same, the daily 200-SMA (green) would be in play.
Before snapping lower levels, the XRP market could witness some short-term gains, just as it did post the 19 May sell-off. This would allow XRP to retest the 78.6% Fibonacci level briefly before sellers engage in profit-taking.
A doji candlestick or bullish spinning top would be the best way to identify this temporary resurgence.
Overall, sellers would likely maintain the upper hand as XRP’s indicators looked to dip below their half-lines.
Reasoning
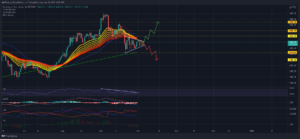
The Relative Strength Index, which had remained above 50 since 26 July, fell below equilibrium for the first time in over 6 weeks. If the index fails to find support above 45, a bearish trend would likely take over in the coming days.
Meanwhile, the Awesome Oscillator formed two lower peaks which signified weakening momentum in the market. A wave of selling pressure usually follows after such a setup.
Finally, the MACD acted as a bit of a precursor to XRP’s decline. The index formed a bearish divergence and has moved south since 23 August. This, even as XRP saw higher levels on the chart. From here, a move below the half-line would invite short sellers.
Conclusion
XRP can be expected to drop towards its 50% and 38.2% Fibonacci levels as its indicators lined up a bearish narrative. A temporary relief up to $1.22 might be possible but expect sellers to respond instantly.
Meanwhile, a less risky maneuver would be to wait for XRP to approach the aforementioned levels before taking a call.
Where to Invest?
Subscribe to our newsletter