XRP has been trading on a bullish streak over the last few days. In the past week, the altcoin appreciated by close to 18%. On the daily chart, however, XRP slipped nearly 4%. Despite the fall on the daily chart, the altcoin was moving with bullish momentum.
The technical outlook of XRP has also sided with the bulls as buying strength has considerably recovered. Demand for the altcoin also noted a positive change. Accumulation also went up the chart as demand registered an increase.
Buyers’ confidence also rose as XRP managed to break past a few important resistance marks. XRP must remain above its immediate support level for the price to keep gaining strength.
With Bitcoin breaking past the $28,500 level, other altcoins will attempt to break past their immediate price ceilings. Currently, XRP is standing at a crucial resistance mark; a fall below this level might bring the bears back for a short period.
XRP Price Analysis: One-Day Chart

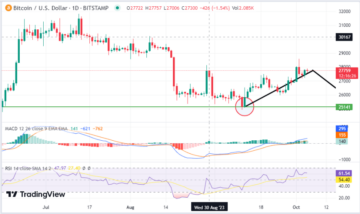
The altcoin was trading at $0.42 at the time of writing. XRP breached two very vital supports over the past week. The $0.39 level had acted as a stiff resistance level, which has now been flipped into a support line for the altcoin. Moving from the current price level will drag XRP to $0.40 and below $0.39.
The overhead price ceiling for the altcoin stood at $0.44; breaching that level will help the altcoin reach $0.46 and eventually $0.50.
The altcoin had reached $0.44 in recent trading sessions, but the bulls could not break through. For XRP to target $0.50, it must breach $0.44 and trade above that level for many trading sessions.
Technical Analysis
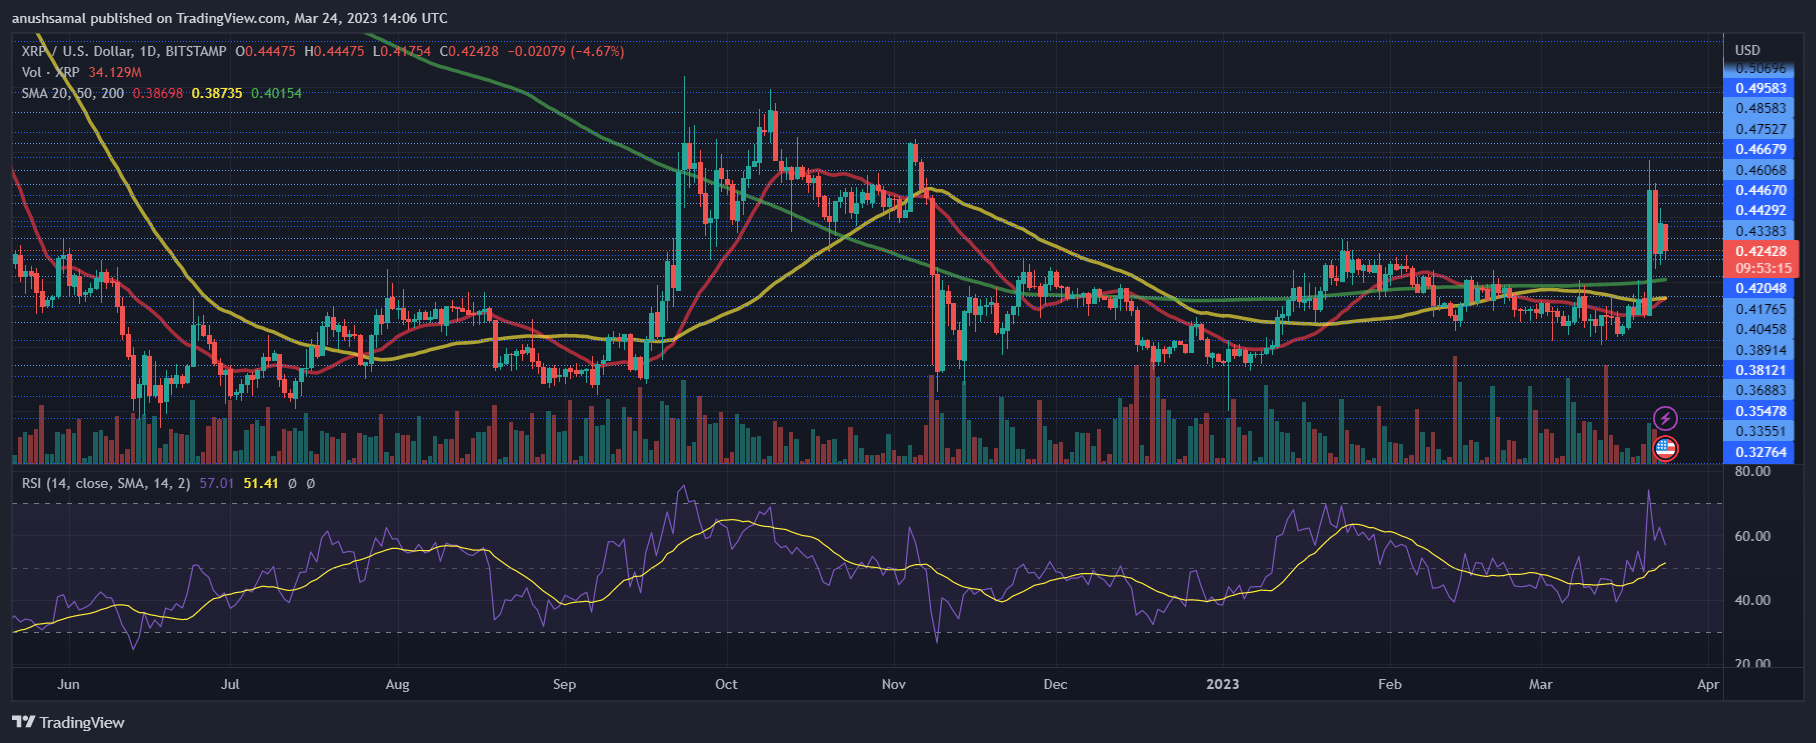
The altcoin was overbought over the past week; however, at press time, it was not. Buying strength remained positive, though.
The Relative Strength Index stood slightly below 60, indicating buyers still controlled the asset. Similarly, with an increase in demand, XRP moved above the 20-Simple Moving Average line, which also depicted that buyers were driving the price momentum in the market.
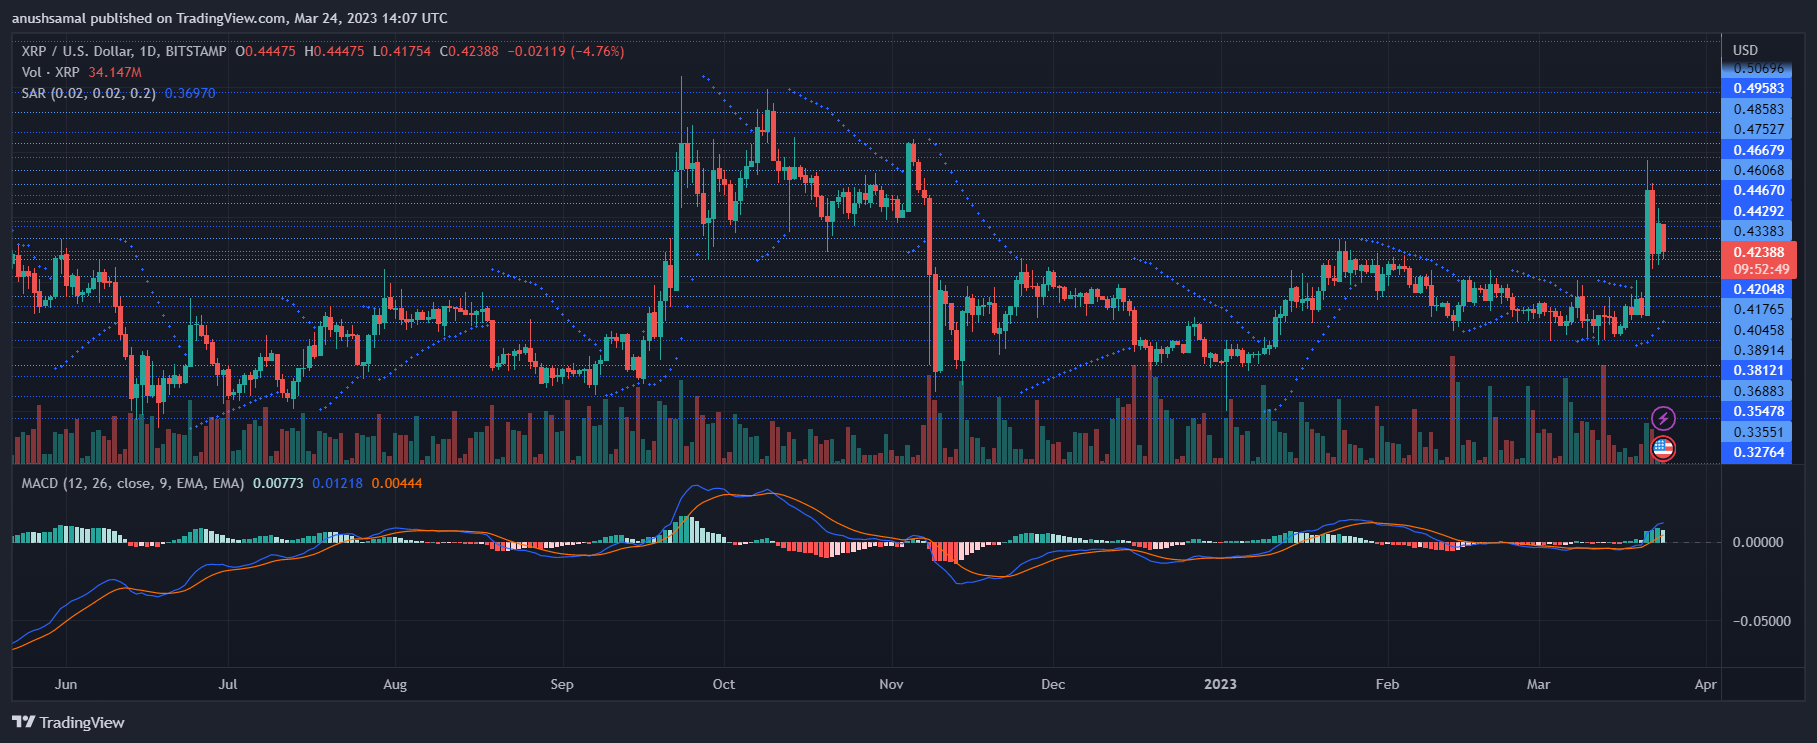
Other technical indicators also depicted that bulls were taking over the market. The Moving Average Convergence Divergence displays the price momentum and reversals in the trend. The indicator turned positive and displayed green histograms tied to buy signals for the altcoin.
Parabolic SAR indicates price direction; the indicator was positive as dotted lines were formed underneath the candlesticks. These dotted lines suggested that the price was on an uptrend at press time.
Featured Image From UnSplash, Charts From TradingView.com
- SEO Powered Content & PR Distribution. Get Amplified Today.
- Platoblockchain. Web3 Metaverse Intelligence. Knowledge Amplified. Access Here.
- Source: https://www.newsbtc.com/analysis/xrp/xrp-might-target-0-50-if-it-continues-to-trade-above-this-level/
- :is
- $0.40
- $UP
- 39
- a
- above
- accumulation
- Altcoin
- Altcoins
- analysis
- and
- AS
- asset
- At
- average
- back
- Bears
- below
- Bitcoin
- breach
- Break
- Breaking
- bring
- Bullish
- Bulls
- buy
- buyers
- Buying
- by
- ceiling
- change
- Chart
- Charts
- Close
- confidence
- considerably
- continues
- controlled
- Convergence
- could
- crucial
- Current
- Currently
- daily
- Days
- Demand
- Despite
- direction
- displays
- Divergence
- driving
- eventually
- Fall
- few
- For
- formed
- from
- gaining
- Green
- help
- However
- HTTPS
- image
- immediate
- important
- in
- Increase
- index
- indicates
- Indicator
- Indicators
- IT
- ITS
- Keep
- Last
- Level
- Line
- lines
- managed
- many
- mark
- Market
- max-width
- might
- Momentum
- moving
- moving average
- nearly
- NewsBTC
- noted
- of
- on
- Other
- Outlook
- past
- period
- plato
- Plato Data Intelligence
- PlatoData
- positive
- press
- price
- Price Analysis
- reach
- reached
- recent
- registered
- relative strength index
- remain
- remained
- Resistance
- ROSE
- sessions
- Short
- signals
- Similarly
- Source
- Still
- strength
- support
- support level
- Supports
- taking
- Target
- Technical
- that
- The
- their
- These
- Through
- Tied
- time
- to
- trade
- Trading
- Trading sessions
- TradingView
- Trend
- Turned
- Unsplash
- uptrend
- vital
- week
- which
- will
- with
- writing
- xrp
- zephyrnet