Ripple rallied above the $0.400 and $0.450 resistance levels against the US Dollar. XRP price is up over 25% and there could be more upsides in the near term.
- Ripple is gaining pace above the $0.450 resistance against the US dollar.
- The price is now trading above $0.45 and the 100 simple moving average (4-hours).
- There was a break above a contracting triangle with resistance near $0.3980 on the 4-hours chart of the XRP/USD pair (data source from Kraken).
- The pair rallied sharply towards $0.500 and there are chances of more upsides in the near term.
Ripple Price Starts Fresh Uptrend
This past week, ripple’s XRP formed a base above the $0.350 zone against the US Dollar. The price started a steady increase above the $0.3650 resistance zone but lagged pace like bitcoin and ethereum.
Finally, the bulls were able to clear a major hurdle near the $0.400 zone. Besides, there was a break above a contracting triangle with resistance near $0.3980 on the 4-hours chart of the XRP/USD pair. The pair rallied over 25% and there was a clear move above the $0.450 resistance.
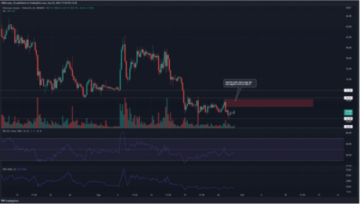
XRP price traded close to the $0.500 resistance. A high was formed near $0.4926 and the price is now correcting gains. It is now trading above $0.45 and the 100 simple moving average (4-hours).
There was a move below the 23.6% Fib retracement level of the upward move from the $0.3720 swing low to $0.4926 high. However, the bulls are active above the $0.450 level. On the upside, an initial resistance is near the $0.4700 zone.

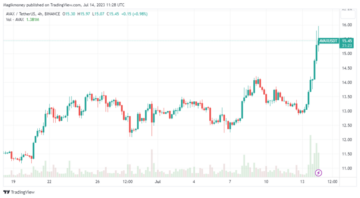
Source: XRPUSD on TradingView.com
The first major resistance is near the $0.4950 level. The next key resistance is near the $0.500 level. A successful break above the $0.500 resistance might send the price towards the $0.525 resistance. Any more gains might send the price towards the $0.540 level.
Dips Supported in XRP?
If ripple fails to clear the $0.495 resistance zone, it could continue to move down. An initial support on the downside is near the $0.450 level.
The next major support is near $0.432. If there is a downside break and close below the $0.432 level, xrp price could extend losses. In the stated case, the price could even test the $0.400 support zone.
Technical Indicators
4-Hours MACD – The MACD for XRP/USD is now losing pace in the bullish zone.
4-Hours RSI (Relative Strength Index) – The RSI for XRP/USD is now above the 50 level.
Major Support Levels – $0.450, $0.432 and $0.40.
Major Resistance Levels – $0.47, $0.495 and $0.500.
- SEO Powered Content & PR Distribution. Get Amplified Today.
- Platoblockchain. Web3 Metaverse Intelligence. Knowledge Amplified. Access Here.
- Source: https://www.newsbtc.com/analysis/xrp/xrp-price-prediction-surge-0-5/
- :is
- $0.40
- $UP
- 100
- a
- Able
- above
- active
- against
- and
- ARE
- average
- base
- BE
- below
- Break
- Bullish
- Bulls
- case
- chances
- Chart
- clear
- Close
- continue
- contracting
- could
- data
- Dollar
- down
- downside
- Even
- extend
- fails
- First
- For
- formed
- fresh
- from
- gaining
- Gains
- High
- However
- HTTPS
- in
- Increase
- index
- initial
- IT
- Key
- key resistance
- Kraken
- larger
- Level
- levels
- like
- losing
- losses
- Low
- MACD
- major
- max-width
- might
- more
- move
- moving
- moving average
- Near
- NewsBTC
- next
- of
- on
- Pace
- past
- plato
- Plato Data Intelligence
- PlatoData
- prediction
- price
- Price Prediction
- relative strength index
- Resistance
- retracement
- Ripple
- rsi
- Simple
- Source
- start
- started
- starts
- stated
- steady
- strength
- successful
- support
- support levels
- Supported
- surge
- test
- The
- to
- towards
- traded
- Trading
- TradingView
- Trend
- Upside
- upward
- us
- US Dollar
- week
- with
- xrp
- XRP Price
- XRP price prediction
- XRP/USD
- zephyrnet