Published 16 hours ago
XRP Price Prediction: Even though the XRP price has turned sideways due to the increasing bearishness in the crypto market, the buyers have managed to defend local support of $0.368 and prevented some excessive losses. On March 3rd, the coin price showed another failed attempt to breach the aforementioned support indicating the sellers continue to defend this support. Can the XRP coin’s retest to $0.368 support resume the prior recovery?
advertisement
Key points:
- The ripple coin price is trapped in a no-trading zone between the downsloping trendline and strong horizontal support of $0.368,
- The flattish EMAs(20, 50, 100, and 200) actuated a sideways trend in XRP.
- The intraday trading volume in the XRP is $590.2 Million, indicating a 48% loss.
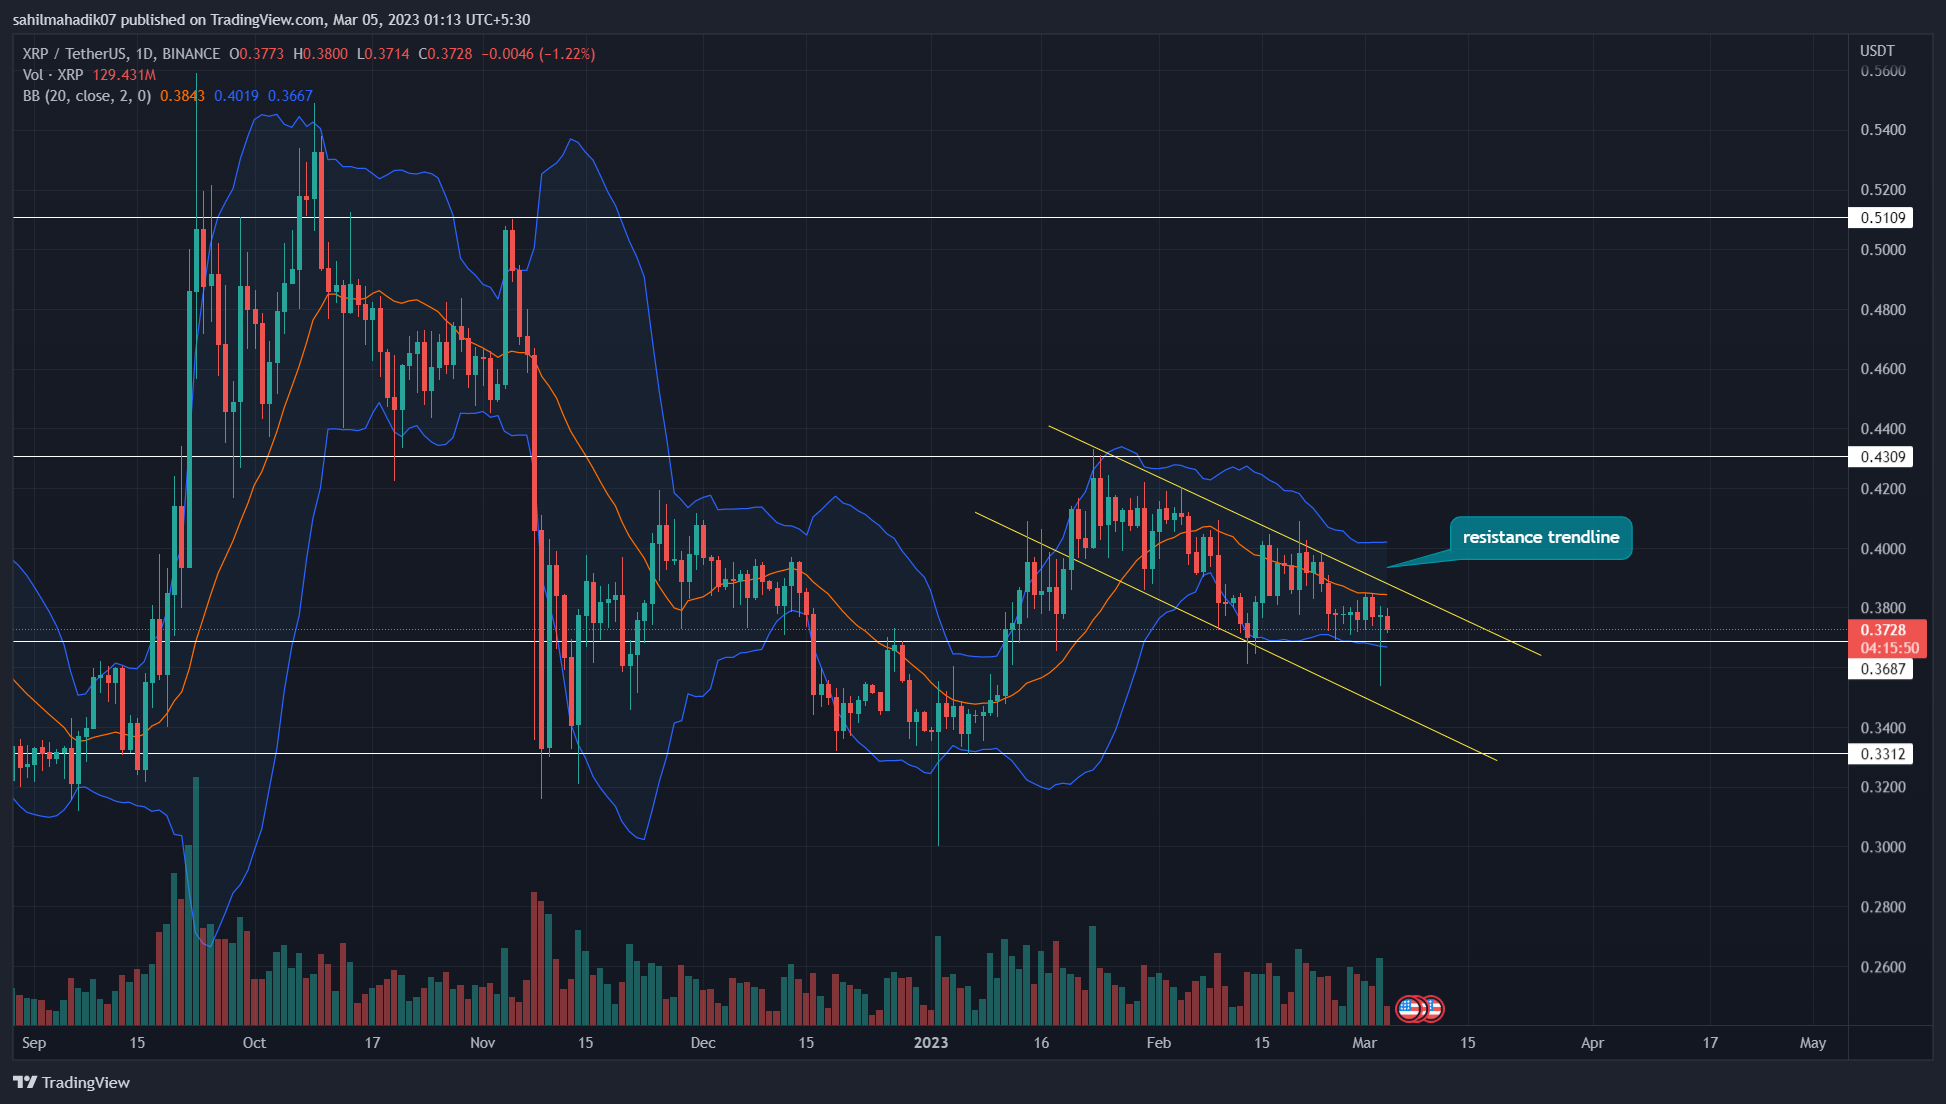
Source- Tradingview
Under the influence of a falling channel pattern, the XRP price has been falling for the past six months. From the peak resistance of $0.431, the coin price has tumbled 13% as it currently trades at the $0.376 mark.
However, the falling XRP price reached local support of $0.369 and turned sideways. Over the past week, the coin price showed multiple short-body and long-wick candles indicating indecisiveness among market participants.
Trending Stories
Also Read: Best Crypto Future Trading Bot 2023 ; Here’s The List
However, this consolidation also reflects the price sustainability above the $0.369 support indicating the buyers continue to accumulate at this support. Thus, the coin holders should keep a close eye on the downsloping trendline and $0.369 support level.
If the selling pressure persists, the coin price could breach the aforementioned support which may flip a potential resistance and assist market selling. This breakdown could pull the prices more than 12% to reach $0.33.
On a contrary note, a breakout above the downsloping trendline could hint at the recuperated bullish momentum and may set the price to reach $0.43.
Technical Indicator
Relative Strength Index: the dailyRSI slope wavering around the midline indicates market sentiment is neutral.
advertisement
Bollinger band: the daily XRP price moving below the Bollinger band indicator, project the sellers have trend control.
‘XRP intraday price levels
- Spot price: $0.376
- Trend: Bullish
- Volatility: High
- Resistance level- $0.4 and $0.43
- Support level- $0.37 and 0.359
Share this article on:
advertisement
The presented content may include the personal opinion of the author and is subject to market condition. Do your market research before investing in cryptocurrencies. The author or the publication does not hold any responsibility for your personal financial loss.
<!– Close Story–>
- SEO Powered Content & PR Distribution. Get Amplified Today.
- Platoblockchain. Web3 Metaverse Intelligence. Knowledge Amplified. Access Here.
- Source: https://coingape.com/markets/xrp-price-prediction-crucial-levels-to-watch-for-xrp-coin-in-coming-week/
- 1
- 10
- 100
- 2023
- 7
- 9
- a
- above
- Accumulate
- Ad
- among
- and
- Another
- around
- article
- assist
- author
- avatar
- BAND
- banner
- Beauty
- before
- below
- between
- blockchain
- Bot
- breach
- Breakdown
- breakout
- Brian
- Bullish
- buyers
- Channel
- Close
- Coin
- Coingape
- COM
- coming
- condition
- consolidation
- content
- continue
- contrary
- control
- could
- crucial
- crypto
- Crypto Market
- cryptocurrencies
- cryptocurrency
- Currently
- daily
- different
- Entertainment
- Ether (ETH)
- Even
- eye
- Failed
- Falling
- Fashion
- finance
- financial
- Flip
- follow
- from
- future
- hold
- holders
- Horizontal
- HOURS
- HTTPS
- in
- include
- Including
- increasing
- index
- indicates
- influence
- investing
- IT
- journalism
- Keep
- Last
- Level
- levels
- local
- loss
- losses
- managed
- March
- mark
- Market
- market research
- market sentiment
- million
- Momentum
- months
- more
- moving
- multiple
- Neutral
- Opinion
- participants
- past
- Peak
- persists
- personal
- plato
- Plato Data Intelligence
- PlatoData
- plugin
- points
- potential
- prediction
- presented
- pressure
- price
- Price Prediction
- Prices
- Prior
- project
- Publication
- reach
- reached
- Read
- recovery
- reflects
- research
- Resistance
- responsibility
- resume
- Ripple
- Sellers
- Selling
- sentiment
- set
- Share
- should
- sideways
- SIX
- Six months
- some
- strength
- strong
- subject
- support
- support level
- Sustainability
- The
- to
- Topics
- trades
- Trading
- trading bot
- trading volume
- TradingView
- Trend
- trending
- Turned
- variety
- volume
- Watch
- week
- which
- working
- written
- xrp
- xrp coin
- XRP Price
- XRP price prediction
- years
- Your
- zephyrnet