With the crypto-market’s cumulative capitalization falling, the market caps of altcoins such as XRP, TRX, and MATIC also fell to about $30 billion, $4.6 billion, and $6.7 billion, respectively. Over the past week, these altcoins noted significant losses, entering the bearish territory at the time of writing.
However, they also continued to move within restricted price ranges as market volatility remained moderate or stable. Even so, sellers remained the most dominant force in the market.
XRP
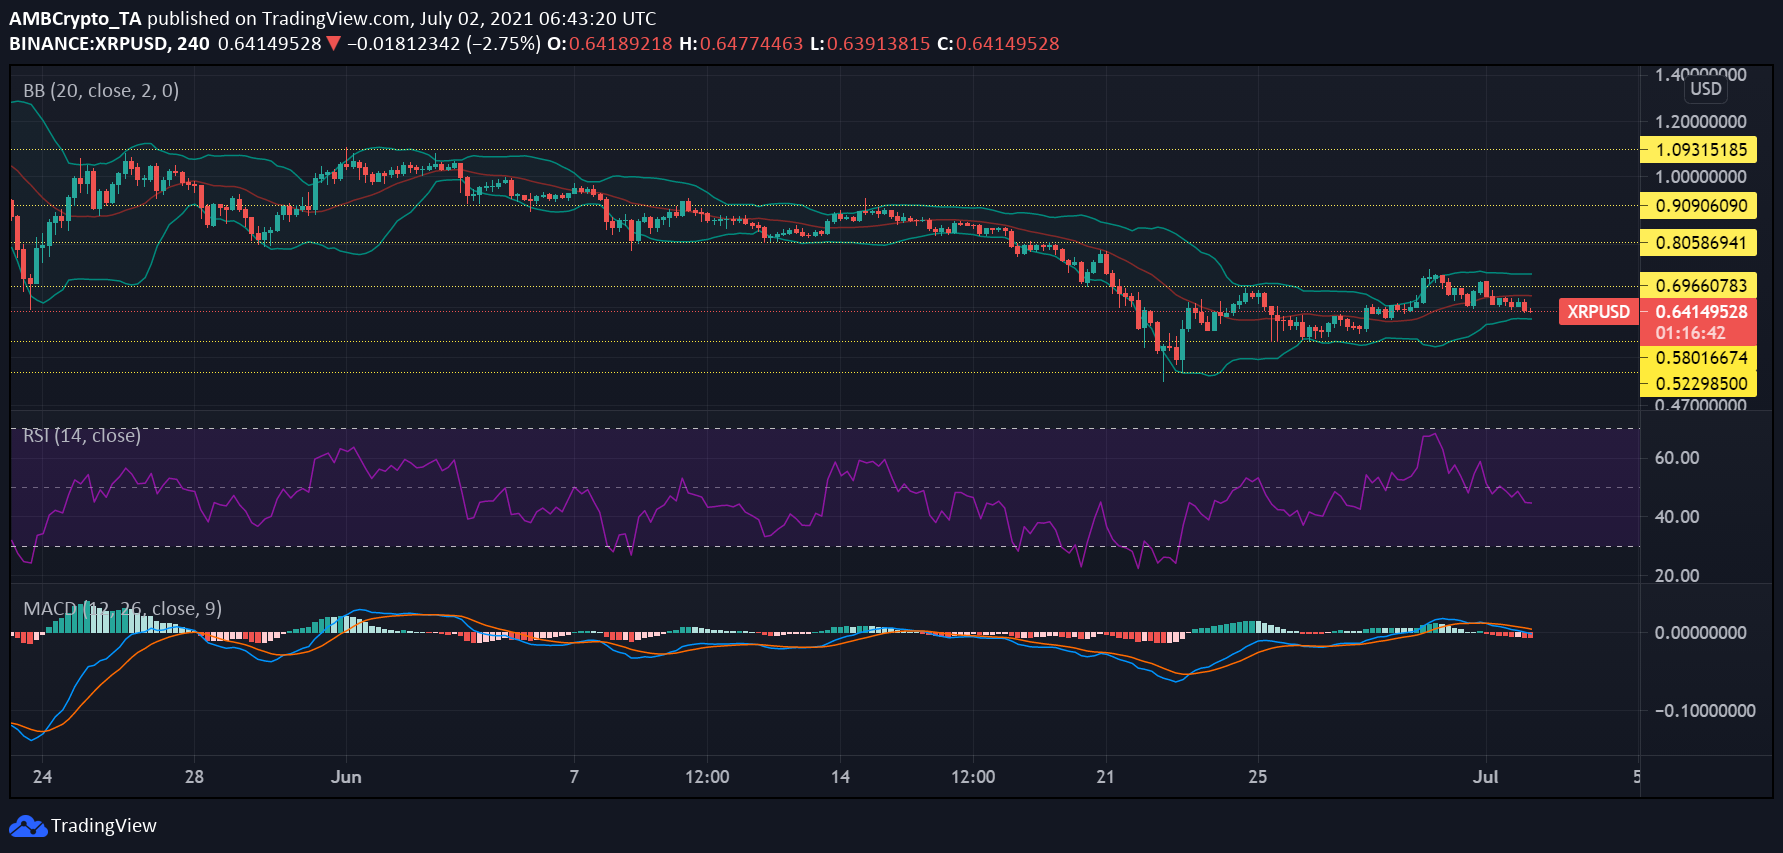
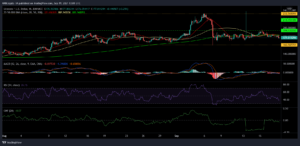
Source: XRP/USD, TradingView
XRP’s 4-hour chart noted significant losses, with a 1-day price decline of 4.9% and a 7-day fall of 3.6%. While the coin breached the $0.69 resistance twice over the past week, it could not sustain it. It continued to find support at $0.58 and was trading at $0.64, at the time of writing.
The Bollinger Bands for the asset moved in a parallel direction, indicating that market volatility was stable and sharp price action was unlikely going forward.
Buying pressure for XRP started mounting the previous day as the Relative Strength Index (RSI) moved below the median line. The indicator has since been oscillating in the neutral bearish zone, and the downtick pointed to the rising dominance of the sellers.
The MACD registered a bearish crossover around the same time as the Signal line (red) moved above the indicator line (blue). A stable market could result in the coin’s price movement being confined between the $0.69 resistance and $0.58 support.
Tron (TRX)

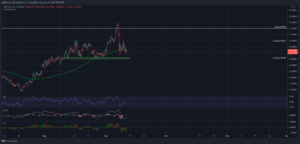
Source: TRX/USD, TradingView
TRX registered only moderate losses over the day, with a 24-hour price fall of 0.9%. After breaching the $0.063 resistance mark on 27 June, the coin found new resistance at $0.070. The earlier resistance level had turned into strong support, one that was being tested at the time of writing. It noted a 24 hour-decline of 6.72% in trading volume and was priced at $0.063.
The Parabolic SAR’s dotted line continued to hover above the candlesticks as the alt’s price movement followed a bearish trend, one corresponding with the price fall on 30 June.
The altcoin’s chart also noted the build-up of bearish momentum, with the appearance of red bars below the line on the Awesome Oscillator’s histogram.
Moreover, capital inflows fell yesterday as the Chaikin Money Flow moved below equilibrium. Outflows were comparatively more prominent, even as the indicator remained below the zero-line in neutral bearish territory. A small uptick at the time of writing meant that inflows were picking up once again, however.
Polygon (MATIC ) :-

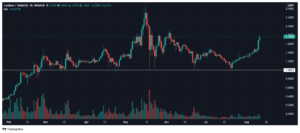
Source: MATIC/USD, TradingView
MATIC experienced an unfavorable week, with the price falling by 11.8% during this period. It was trading at $1.056 at press time, and its price action has been sandwiched between the $1.253 resistance and $1.006 support levels since 21 June. The 17th-highest ranked coin lost 3.91% of its market cap over the last 24 hours and was down 59.9% from its ATH in May.
The Bollinger Bands for MATIC had started to diverge, pointing to a hike in market volatility and sharp price action can be expected going forward. The Parabolic SAR’s dotted line has hovered above the candlesticks since 30 June as the coin’s price movement followed a bearish trend.
The Relative Strength Index (RSI) moved below the median line around the same time, as selling pressure mounted and surpassed the buying pressure. The indicator was at 41 at the time of writing, and its southbound movement underlined the continuing dominance of sellers.
Source: https://ambcrypto.com/xrp-tron-matic-price-analysis-02-july/