
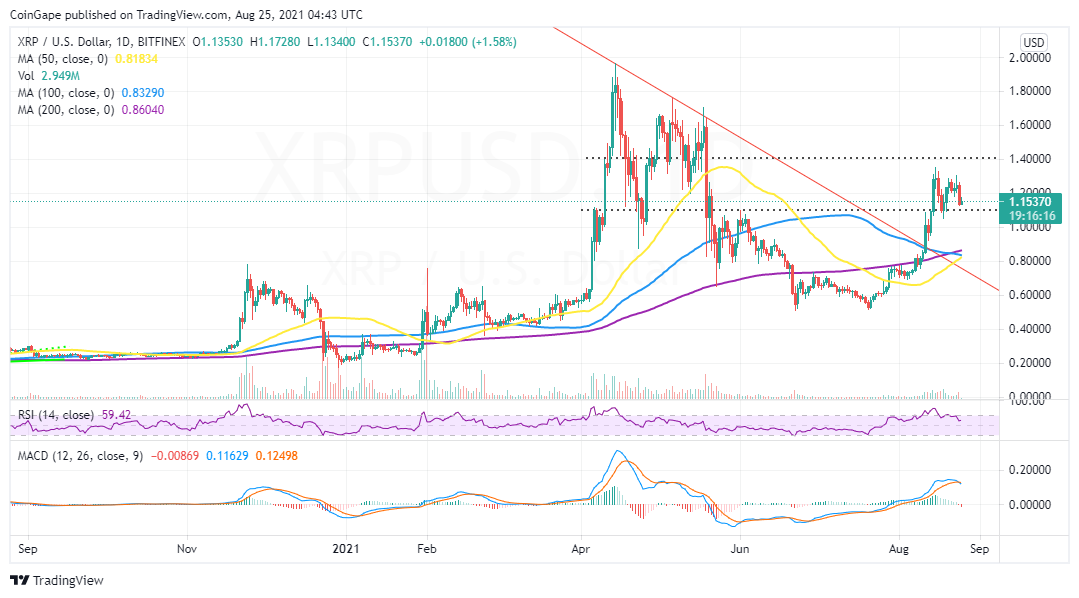
- Based on the overall technical picture, Ripple could drop further to test support at $1 in the near term.
- Cardano falters at $3 as correction revisits $2.7 support; more losses could follow if the MACD flashes a sell signal.
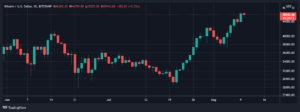
The trading mid this week has been marred by considerable losses across the board. Bitcoin is at the forefront of the gains-trimming exercise after losing support at $49,000 to test levels slightly below $48,000. As discussed, $56,000 is the robust support. If this buyer congestion zone is revisited, Bitcoin will resume the uptrend, significantly lifting above $50,000.
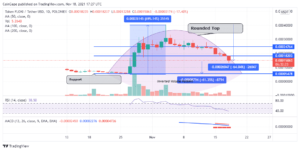
Ripple:-
The cross-border money transfer token is holding marginally above $1.1. It has not been spared by the bearish wave sweeping across the market on Wednesday. A recent break above $1.3 fails to gather the strength needed to sustain the uptrend; Investors hoped that a daily close past $1.4 would bolster Ripple to $1.6, but they are now forced to deal with intensifying overhead pressure.
As observed on the daily chart, the Moving Average Convergence Divergence (MACD) has a vivid bearish impulse. As XRP lost ground toward $1.1, a sell signal occurred, suggesting that losses will gain traction in the short term.
Therefore, failure to keep the price afloat at $1.1 could culminate in losses to $1 and perhaps revisit $0.9. Realize that the Relative Strength Index’s (RSI) retreat from the overbought toward the mean line accentuates the bearish outlook. In other words, the seller has the upper hand and may continue to control the price unless support at $1.1 firmly holds.
XRP/USD Daily Chart
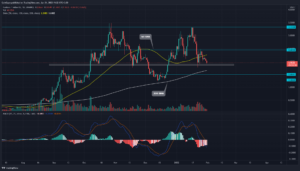
Cardano:
Cardano seems to have started retracing its steps after hitting a new all-time high around $3. The latest smart contract token is trading at $2.73 amid a spike in overhead pressure. Perhaps this is just a temporary fallback because many analysts believe that ADA is headed for $5 in the medium term.
Meanwhile, the correction may carry on if the MACD flashes a sell signal. Currently, the technical index holds at 0.35, but the RSI in the same daily timeframe shows highly overbought conditions. Hence, an extended correction is probable, with investors looking to consolidate gains before boarding the spacecraft to the moon.
ADA/USD Daily Chart
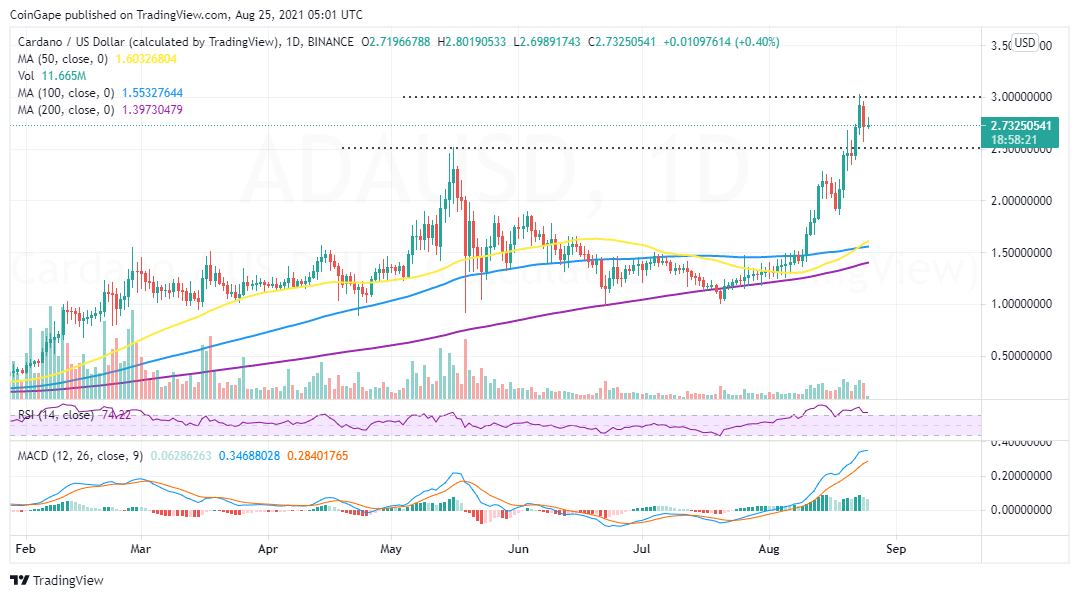
Meanwhile, if support at $2.7 remains intact in the coming sessions, we expect stability to return as Cardano makes haste above $3. Trading past this level may trigger more buy orders, with investors looking forward to $5.
advertisement
Disclaimer
The presented content may include the personal opinion of the author and is subject to market condition. Do your market research before investing in cryptocurrencies. The author or the publication does not hold any responsibility for your personal financial loss.

Handpicked Stories
Related Posts
Loading Next Story
Source: https://coingape.com/ripple-cardano-price-analysis-august-24-2021/
- "
- 000
- 2021
- 7
- 77
- 9
- ADA
- ADA/USD
- All
- Altcoin
- Altcoin News
- amp
- analysis
- around
- article
- AUGUST
- bearish
- Bitcoin
- board
- buy
- Cardano
- Cardano (ADA)
- cardano price
- Carry On
- Coingape
- coming
- comments
- content
- continue
- contract
- creator
- cross-border
- cryptocurrencies
- deal
- Drop
- Exercise
- Failure
- financial
- follow
- Forward
- High
- hold
- HTTPS
- ICON
- image
- index
- investing
- Investors
- IT
- large
- latest
- Level
- Line
- MACD
- Market
- market research
- medium
- money
- Moon
- Near
- news
- Opinion
- orders
- Other
- Outlook
- picture
- pressure
- price
- Price Analysis
- Profile
- research
- Ripple
- Ripple (XRP)
- robots
- sell
- Share
- Short
- smart
- smart contract
- spacecraft
- Stability
- started
- support
- Technical
- temporary
- test
- token
- Trading
- W
- Wave
- week
- words
- XML
- XRP/USD


✓ Share: