As Deutsche Bank’s head credit strategist – and amateur golfer – Jim Reid writes this morning, the “only thing more complicated than unlocking a golf swing is working out bond markets in an era of extreme intervention.”
Just like the market strategists at Morgan Stanley and Goldman Sachs, Reid says that one of the questions he has received most from clients over the last week or so is why US Treasuries have rallied so much over recent weeks in the face of what is unambiguously higher inflation data.
To help answer the confusion, Reid directs his readers to a Friday blog post by one of his DB credit colleagues, Francis Yared, who helped explain this seemingly paradoxical divergence, with 5 core summary reasons between the divergence in fundamentals and market reality
But first, here are right core observations about the current state of inflation-Treasury divergence (which we also discussed last week):
1. US labor market: NFP surprised to the downside two months in a row, which led the market to price a delay in any Fed tapering announcement. However, while the Fed and the market may be more fixated on NFP, the JOLTs quits rate reached a historical high and it is empirically and theoretically more relevant than NFP in measuring labour market slack. Theoretically, it captures the bargaining power of workers, abstracting from issues such as the participation rate. Empirically, it is a much better predictor of real wages than either the unemployment rate or the employment to population ratio. The divergence between NFP and the quits rate is symptomatic of supply constraints, which are also evident in other measures of the labour market (such as job plentiful vs. hard to get). While these supply constraints are expected to fade, they have immediate implications for wages. Higher wages is one channel through which a temporary shock to inflation can become more persistent
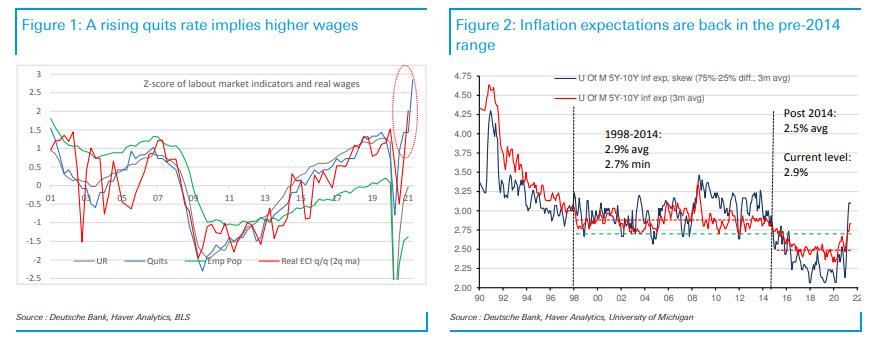
2. US Inflation: NFP weakness aside, core inflation surprised to the upside three months in a row and core PCE is currently tracking to be ~0.8% above the FOMC’s latest projections. So far, the upside surprises are primarily driven by factors related to the reopening, and therefore prone to be transitory. However, slow moving drivers such as OER have started to turn and leading indicators are consistent with more upside. More importantly, the rise in the University of Michigan inflation expectations is relevant from both a theoretical and an empirical perspective. Inflation expectations is the mechanism through which an (initially) transitory inflation shock becomes permanent. Empirically, this measure of inflation expectations has historically identified inflation regimes and helped determine: (1) the bond/equity correlation, (2) Fed expectations and the bond term premium, (3) the Phillips curve, (4) 5y5y breakevens and (5) monetary policy (frequently mentioned by Clarida amongst others).
3. Central banks: While we await the FOMC meeting, the ECB has been more dovish than expected a few weeks ago. This is reflected in the fact that the Governing Council reiterated that the pace of the PEPP in Q3 will “continue to be conducted at a significantly higher pace than during the first months of the year”, despite a sizeable upgrade to growth and a more modest one to inflation forecasts. While the current wording leaves some leeway for purchases to be lower (seasonally adjusted) than in Q2, the base case for now is that the ECB will maintain the same (seasonally adjusted) pace. This is relevant for USTs given that supply/demand factors for safe assets such as USTs and Bunds are global rather than local. Also, the TGA balance has declined by close to $1 trillion since February. While some of the liquidity injection has been absorbed by the RRP since April, excess reserves have
increased markedly in March and could, with a lag, have a QE like impact on the
market.
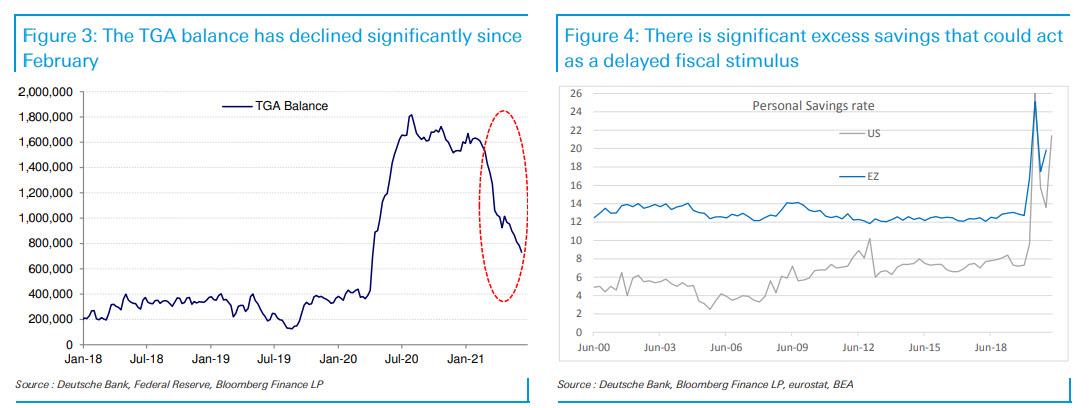
4. US fiscal policy: The political momentum for a large US infrastructure package seems to have faded. As a result, expectations for the size of the package have been revised lower, but the base case remains that something will be passed later this year. Also, there is still ~10% of GDP excess savings in the system which has the potential to deliver a delayed fiscal stimulus.
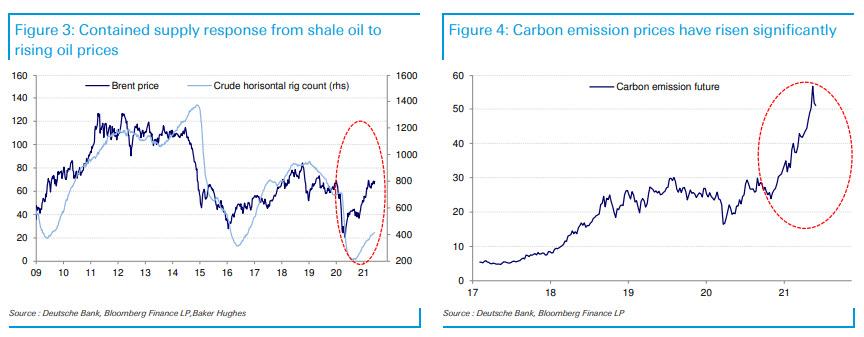
5. ESG/oil: As discussed here, ESG is a negative supply shock which is unwinding the shale oil revolution. This is being reflected in a weaker supply response to higher oil prices.
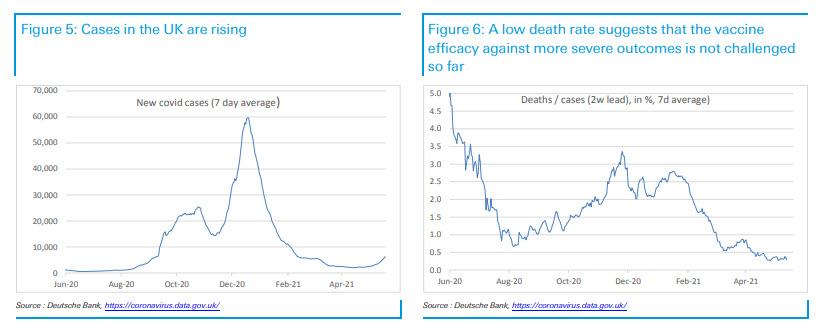
6. Covid19 : The rise of the Delta variant is challenging the efficacy of some vaccines against transmission and is likely to delay the full reopening of the UK economy. However, the more important protection against more severe illness does not appear to be compromised so far as hospitalization rates and death rates are lower than pre-vaccines. Nonetheless, the media furore over the Delta variant increases the risk that the steady state level of reopening could be lower than expected.
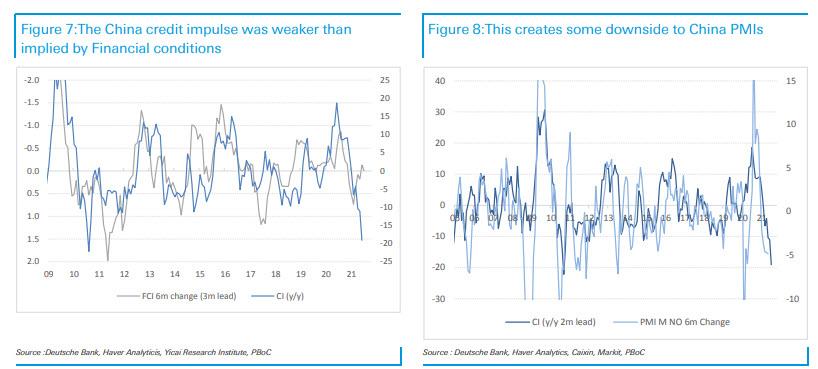
7. China and industrial commodities stalling even if oil hovers within $2-3 of 6.5 year highs: The decline in the credit impulse was worse than implied by leading indicators. The latter are still consistent with a credit impulse returning to neutral. In the meantime, there may be more downside risks to China’s manufacturing PMI. Industrial metals have stalled potentially in response to the weaker China data. But as discussed below , they remain consistent with much higher UST10y.
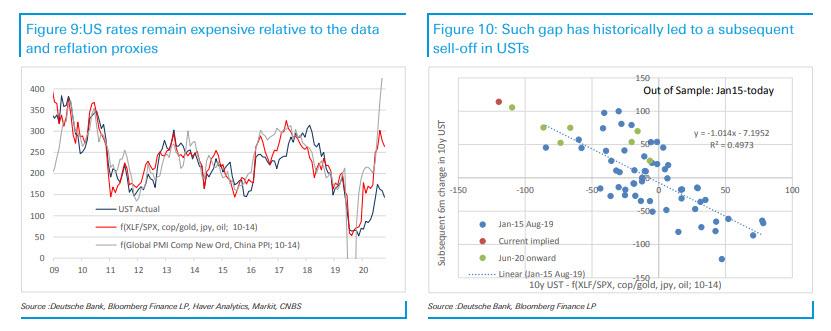
8. Valuations vs. reflation proxies and the data: 10y TSY valuations relative to the reflation proxies and the data remain stretched. However, the purpose of AIT is precisely to create such a gap: by pushing real rates lower it raises inflation expectations and reflation proxies higher. How much of the gap could be explained by AIT? In the current environment, AIT can be construed as a commitment to delay rate hikes by two to three years relative to the counterfactual. Thus, the 10y rate under AIT would incorporate two to three years at 0bp at the beginning of the 10y period vs. a counterfactual of e.g. ~2.5% at the end of the 10y period. Thus, under this simple approach, AIT would depress UST10s by 50b-75bp. This leaves another 50-75bp to explain.
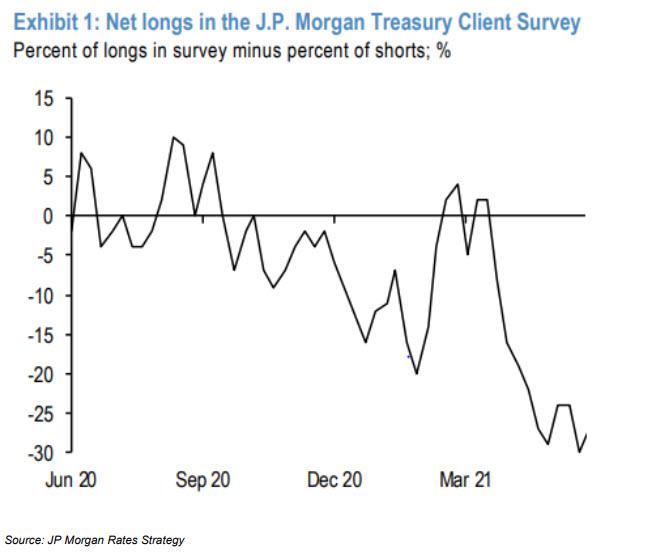
DB’s conclusion is that leaving positioning aside – which one obviously can’t do because as we noted last week just before the big move in yields lower, everyone was short rates…
… the analysis offers potential explanations for the rates rally:
-
weaker NFP;
-
more dovish ECB and injection of liquidity via the decline in the TGA balance;
-
sharper decline of credit growth in China and industrial commodities stalling;
-
reduced expectations for the US infrastructure package; and
-
Covid Delta variant raising question marks about the steady state level of reopening later this year.
However, as Yared cautions, elements that would be associated with a more persistent shock to inflation are starting to emerge. The quits rate is at a historical high (a good leading indicator of wages), consumer inflation expectations have unwound the post 2014 low inflation regime and there is increased evidence of the negative supply shock generated by ESG. Moreover, the base case remains that an infrastructure package (albeit smaller in size) will be approved and the vaccines efficacy against severe illness has not been challenged.
Last but not least, valuations relative to reflation proxies and the data remain stretched even after accounting for a generous impact of AIT on the level of rates. As a result, DB says that its strategic view is still for higher rates and inflation expectations that as a minimum are back in the 1998-2014 range.
- Accounting
- analysis
- Announcement
- April
- Assets
- Bank
- Banks
- Blog
- Central Banks
- China
- clients
- Commodities
- confusion
- consumer
- continue
- Council
- credit
- Current
- Current state
- curve
- data
- delay
- Delta
- Deutsche Bank
- driven
- ECB
- economy
- employment
- Environment
- ESG
- Face
- Fed
- First
- Friday
- full
- Fundamentals
- gap
- GDP
- Global
- goldman
- Goldman Sachs
- good
- Growth
- head
- here
- High
- How
- HTTPS
- illness
- image
- Impact
- industrial
- inflation
- Infrastructure
- issues
- IT
- Job
- labor
- Labour
- large
- latest
- leading
- Led
- Level
- Liquidity
- local
- manufacturing
- March
- Market
- Markets
- measure
- Media
- Michigan
- Momentum
- months
- morgan stanley
- move
- Offers
- Oil
- Other
- Others
- perspective
- policy
- population
- power
- Premium
- price
- protection
- purchases
- raises
- rally
- range
- Rates
- readers
- reasons
- response
- Risk
- safe
- Short
- Simple
- Size
- slack
- So
- stanley
- started
- State
- stimulus
- Strategic
- supply
- system
- temporary
- Tracking
- treasury
- Uk
- unemployment
- university
- University of Michigan
- us
- vaccines
- Valuations
- View
- week
- What is
- WHO
- within
- workers
- working out
- year
- years