Image by Author
One of the fields that underpins data science is machine learning. So, if you want to get into data science, understanding machine learning is one of the first steps you need to take.
But where do you start? You start by understanding the difference between the two main types of machine learning algorithms. Only after that, we can talk about individual algorithms that should be on your priority list to learn as a beginner.
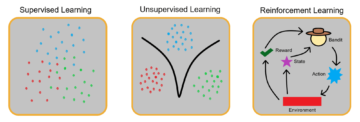
The main distinction between the algorithms is based on how they learn.
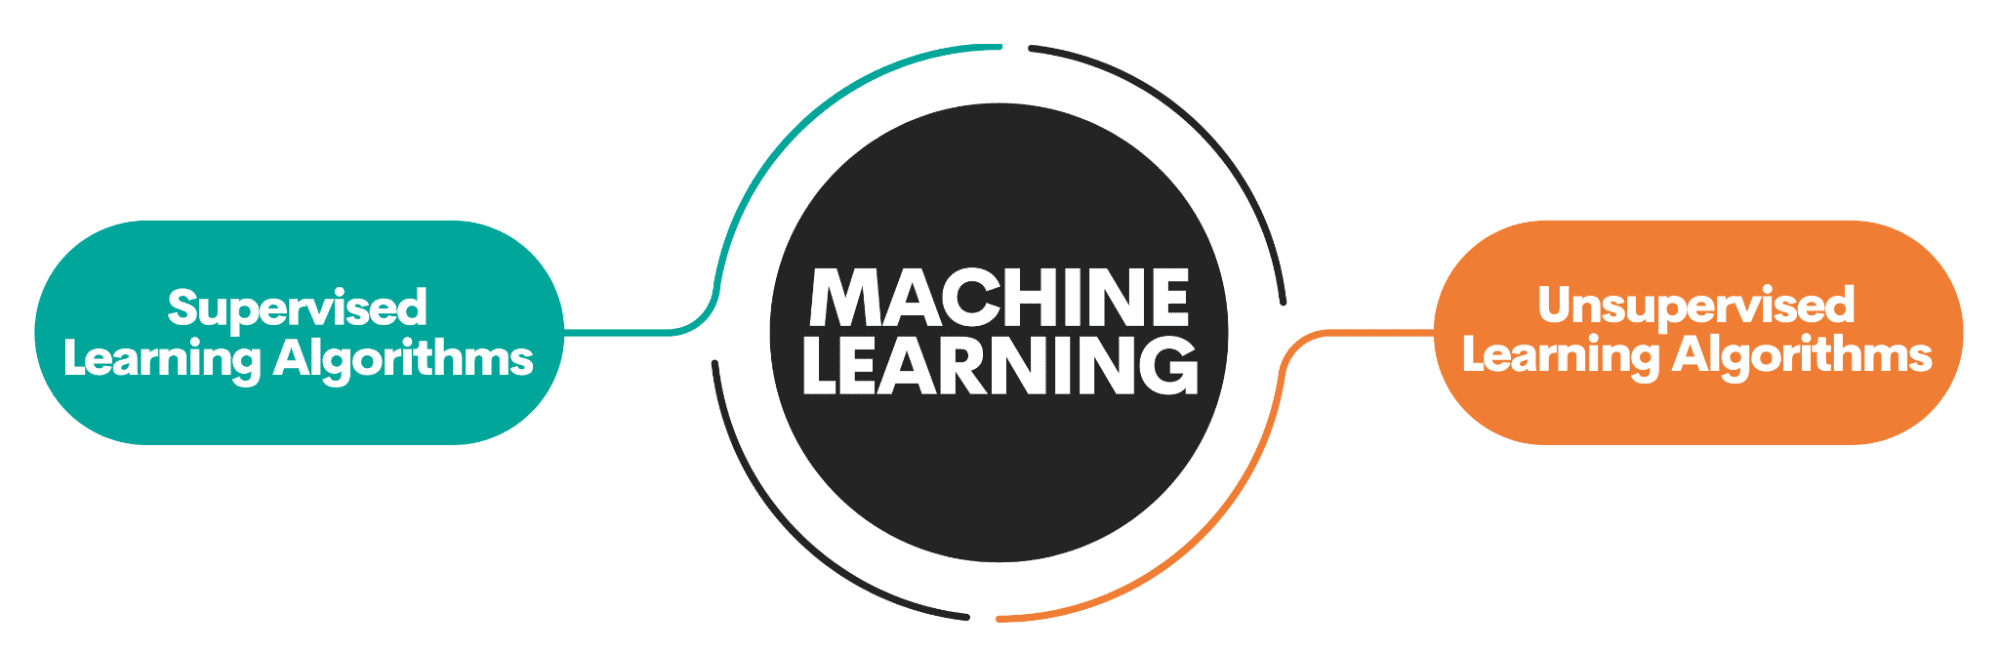
Image by Author
Supervised learning algorithms are trained on a labeled dataset. This dataset serves as a supervision (hence the name) for learning because some data it contains is already labeled as a correct answer. Based on this input, the algorithm can learn and apply that learning to the rest of the data.
On the other hand, unsupervised learning algorithms learn on an unlabeled dataset, meaning they engage in finding patterns in data without humans giving directions.
You can read more in detail about machine learning algorithms and types of learning.
There are also some other types of machine learning, but not for beginners.
Algorithms are employed to solve two main distinct problems within each type of machine learning.
Again, there are some more tasks, but they are not for beginners.
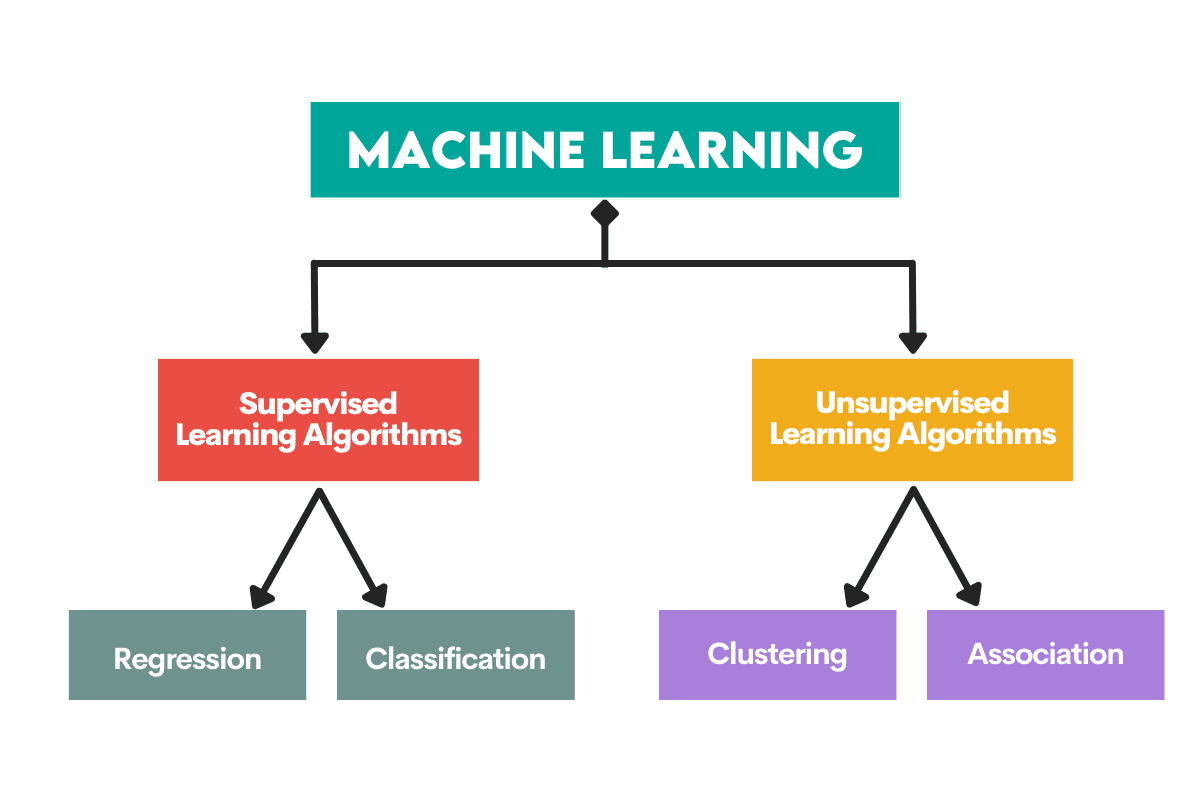
Image by Author
Supervised Learning Tasks
Regression is the task of predicting a numerical value, called continuous outcome variable or dependent variable. The prediction is based on the predictor variable(s) or independent variable(s).
Think about predicting oil prices or air temperature.
Classification is used to predict the category (class) of the input data. The outcome variable here is categorical or discrete.
Think about predicting if the mail is spam or not spam or if the patient will get a certain disease or not.
Unsupervised Learning Tasks
Clustering means dividing data into subsets or clusters. The goal is to group data as naturally as possible. This means that data points within the same cluster are more similar to each other than to data points from other clusters.
Dimensionality reduction refers to reducing the number of input variables in a dataset. It basically means reducing the dataset to very few variables while still capturing its essence.
Here’s an overview of the algorithms I’ll cover.
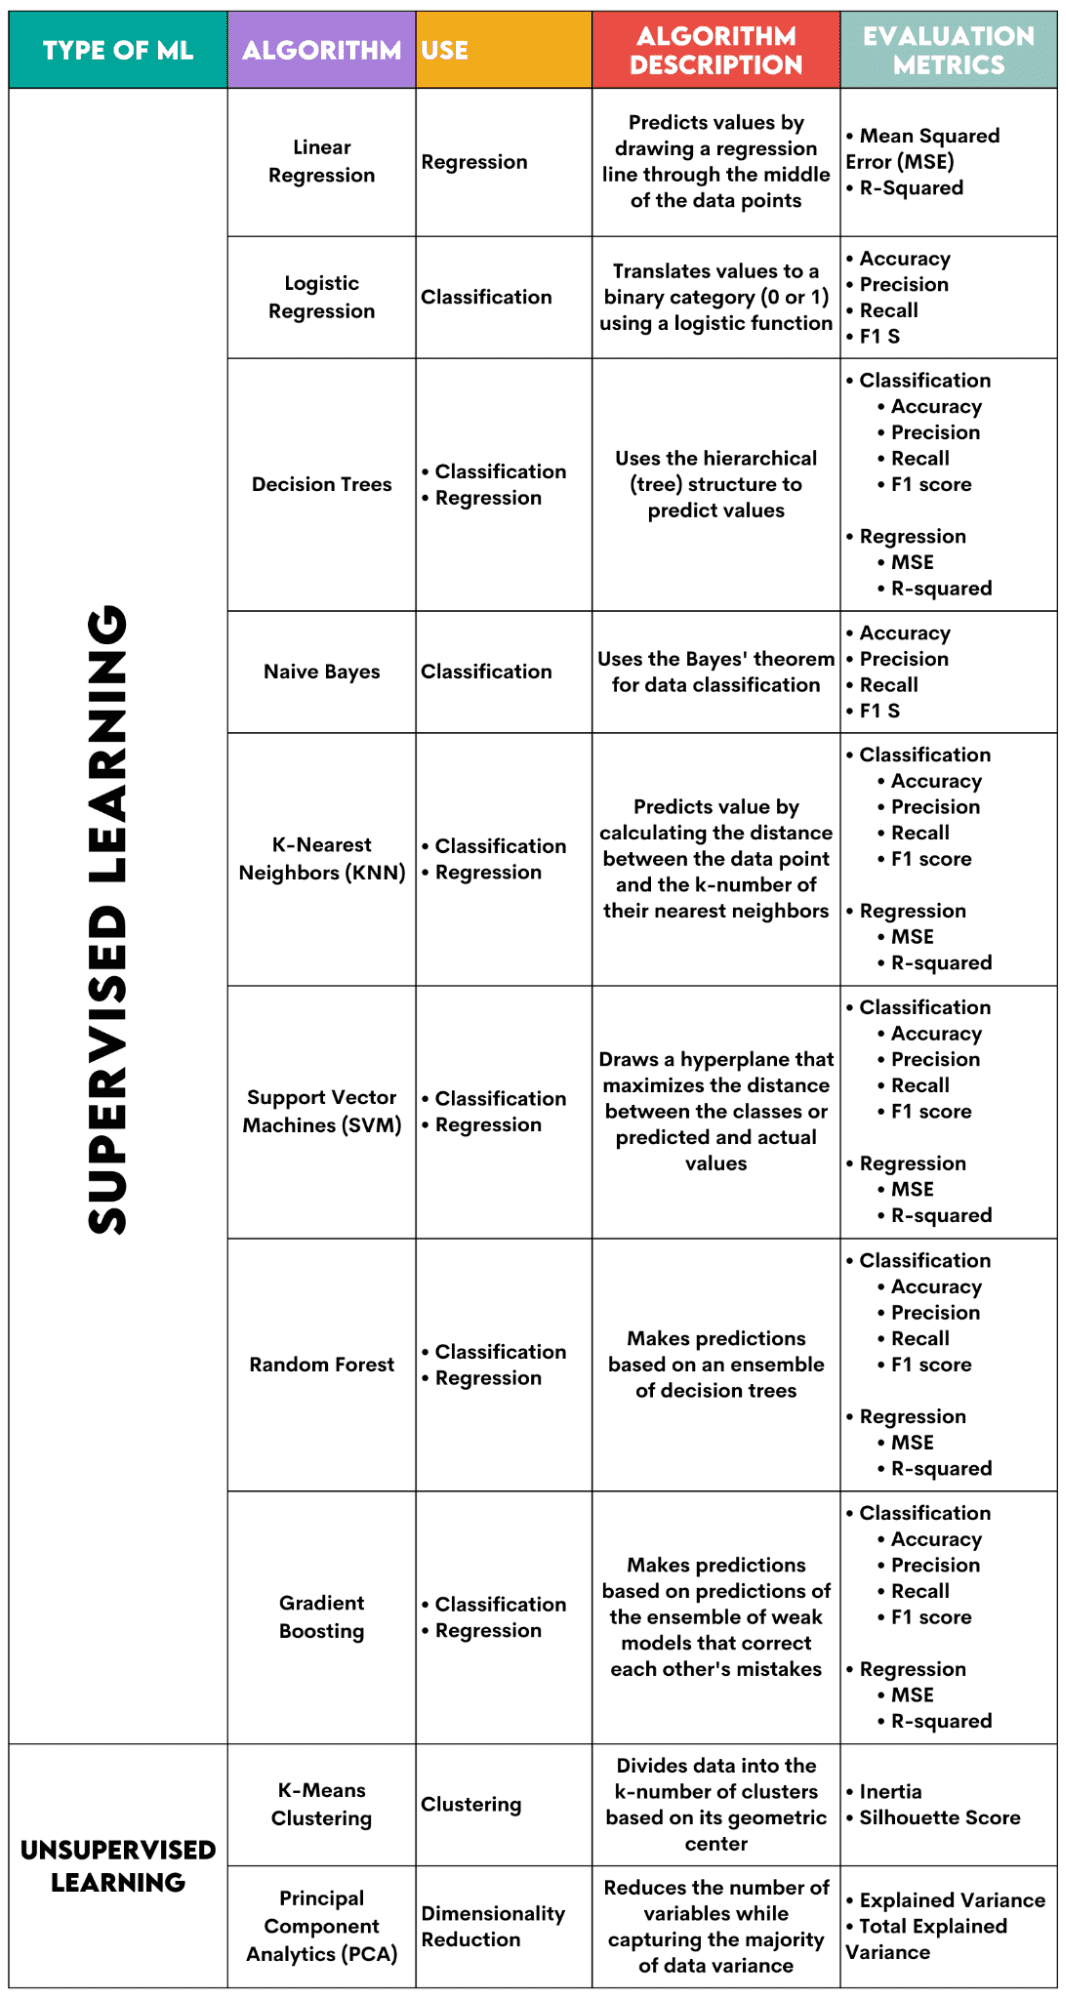
Image by Author
Supervised Learning Algorithms
When choosing the algorithm for your problem, it’s important to know what task the algorithm is used for.
As a data scientist, you’ll probably apply these algorithms in Python using the scikit-learn library. Although it does (almost) everything for you, it’s advisable that you know at least the general principles of each algorithm’s inner workings.
Finally, after the algorithm is trained, you should evaluate how well it performs. For that, each algorithm has some standard metrics.
1. Linear Regression
Used For: Regression
Description: Linear regression draws a straight line called a regression line between the variables. This line goes approximately through the middle of the data points, thus minimizing the estimation error. It shows the predicted value of the dependent variable based on the value of the independent variables.
Evaluation Metrics:
- Mean Squared Error (MSE): Represents the average of the squared error, the error being the difference between actual and predicted values. The lower the value, the better the algorithm performance.
- R-Squared: Represents the variance percentage of the dependent variable that can be predicted by the independent variable. For this measure, you should strive to get to 1 as close as possible.
2. Logistic Regression
Used For: Classification
Description: It uses a logistic function to translate the data values to a binary category, i.e., 0 or 1. This is done using the threshold, usually set at 0.5. The binary outcome makes this algorithm perfect for predicting binary outcomes, such as YES/NO, TRUE/FALSE, or 0/1.
Evaluation Metrics:
- Accuracy: The ratio between correct and total predictions. The closer to 1, the better.
- Precision: The measure of model accuracy in positive predictions; shown as the ratio between correct positive predictions and total expected positive outcomes. The closer to 1, the better.
- Recall: It, too, measures the model’s accuracy in positive predictions. It is expressed as a ratio between correct positive predictions and total observations made in the class. Read more about these metrics here.
- F1 Score: The harmonic mean of the model’s recall and precision. The closer to 1, the better.
3. Decision Trees
Used For: Regression & Classification
Description: Decision trees are algorithms that use the hierarchical or tree structure to predict value or a class. The root node represents the whole dataset, which then branches into decision nodes, branches, and leaves based on the variable values.
Evaluation Metrics:
- Accuracy, precision, recall, and F1 score -> for classification
- MSE, R-squared -> for regression
4. Naive Bayes
Used For: Classification
Description: This is a family of classification algorithms that use Bayes’ theorem, meaning they assume the independence between features within a class.
Evaluation Metrics:
- Accuracy
- Precision
- Recall
- F1 score
5. K-Nearest Neighbors (KNN)
Used For: Regression & Classification
Description: It calculates the distance between the test data and the k-number of the nearest data points from the training data. The test data belongs to a class with a higher number of ‘neighbors’. Regarding the regression, the predicted value is the average of the k chosen training points.
Evaluation Metrics:
- Accuracy, precision, recall, and F1 score -> for classification
- MSE, R-squared -> for regression
6. Support Vector Machines (SVM)
Used For: Regression & Classification
Description: This algorithm draws a hyperplane to separate different classes of data. It is positioned at the largest distance from the nearest points of every class. The higher the distance of the data point from the hyperplane, the more it belongs to its class. For regression, the principle is similar: hyperplane maximizes the distance between the predicted and actual values.
Evaluation Metrics:
- Accuracy, precision, recall, and F1 score -> for classification
- MSE, R-squared -> for regression
7. Random Forest
Used For: Regression & Classification
Description: The random forest algorithm uses an ensemble of decision trees, which then make a decision forest. The algorithm’s prediction is based on the prediction of many decision trees. Data will be assigned to a class that receives the most votes. For regression, the predicted value is an average of all the trees’ predicted values.
Evaluation Metrics:
- Accuracy, precision, recall, and F1 score -> for classification
- MSE, R-squared -> for regression
8. Gradient Boosting
Used For: Regression & Classification
Description: These algorithms use an ensemble of weak models, with each subsequent model recognizing and correcting the previous model’s errors. This process is repeated until the error (loss function) is minimized.
Evaluation Metrics:
- Accuracy, precision, recall, and F1 score -> for classification
- MSE, R-squared -> for regression
Unsupervised Learning Algorithms
9. K-Means Clustering
Used For: Clustering
Description: The algorithm divides the dataset into k-number clusters, each represented by its centroid or geometric center. Through the iterative process of dividing data into a k-number of clusters, the goal is to minimize the distance between the data points and their cluster’s centroid. On the other hand, it also tries to maximize the distance of these data points from the other clusters’s centroid. Simply put, the data belonging to the same cluster should be as similar as possible and as different as data from other clusters.
Evaluation Metrics:
- Inertia: The sum of the squared distance of each data point’s distance from the closest cluster centroid. The lower the inertia value, the more compact the cluster.
- Silhouette Score: It measures the cohesion (data’s similarity within its own cluster) and separation (data’s difference from other clusters) of the clusters. The value of this score ranges from -1 to +1. The higher the value, the more the data is well-matched to its cluster, and the worse it is matched to other clusters.
10. Principal Component Analytics (PCA)
Used For: Dimensionality Reduction
Description: The algorithm reduces the number of variables used by constructing new variables (principal components) while still attempting to maximize the captured variance of the data. In other words, it limits data to its most common components while not losing the essence of the data.
Evaluation Metrics:
- Explained Variance: The percentage of the variance covered by each principal component.
- Total Explained Variance: The percentage of the variance covered by all principal components.
Machine learning is an essential part of data science. With these ten algorithms, you’ll cover the most common tasks in machine learning. Of course, this overview gives you only a general idea of how each algorithm works. So, this is just a start.
Now, you need to learn how to implement these algorithms in Python and solve real problems. In that, I recommend using scikit-learn. Not only because it’s a relatively easy-to-use ML library but also because of its extensive materials on ML algorithms.
Nate Rosidi is a data scientist and in product strategy. He’s also an adjunct professor teaching analytics, and is the founder of StrataScratch, a platform helping data scientists prepare for their interviews with real interview questions from top companies. Nate writes on the latest trends in the career market, gives interview advice, shares data science projects, and covers everything SQL.
- SEO Powered Content & PR Distribution. Get Amplified Today.
- PlatoData.Network Vertical Generative Ai. Empower Yourself. Access Here.
- PlatoAiStream. Web3 Intelligence. Knowledge Amplified. Access Here.
- PlatoESG. Carbon, CleanTech, Energy, Environment, Solar, Waste Management. Access Here.
- PlatoHealth. Biotech and Clinical Trials Intelligence. Access Here.
- Source: https://www.kdnuggets.com/a-beginner-guide-to-the-top-10-machine-learning-algorithms?utm_source=rss&utm_medium=rss&utm_campaign=a-beginners-guide-to-the-top-10-machine-learning-algorithms
- :has
- :is
- :not
- :where
- 1
- 10
- 5
- a
- About
- accuracy
- actual
- adjunct
- advice
- advisable
- After
- AIR
- algorithm
- algorithms
- All
- almost
- already
- also
- Although
- an
- analytics
- and
- answer
- Apply
- approximately
- ARE
- AS
- assigned
- assume
- At
- attempting
- average
- based
- Basically
- BE
- because
- Beginner
- Beginners
- being
- belonging
- belongs
- Better
- between
- binary
- branches
- but
- by
- calculates
- called
- CAN
- captured
- Capturing
- Career
- Category
- certain
- choosing
- chosen
- class
- classes
- classification
- Close
- closer
- closest
- Cluster
- cohesion
- Common
- compact
- Companies
- component
- components
- constructing
- contains
- correct
- course
- cover
- covered
- covers
- data
- data points
- data science
- data scientist
- decision
- dependent
- detail
- difference
- different
- directions
- Disease
- distance
- distinct
- distinction
- divides
- dividing
- do
- does
- done
- draws
- e
- each
- easy-to-use
- employed
- engage
- error
- Errors
- essence
- essential
- Ether (ETH)
- evaluate
- Every
- everything
- expected
- explained
- expressed
- f1
- family
- Features
- few
- Fields
- finding
- First
- first steps
- For
- forest
- founder
- from
- function
- General
- get
- gives
- Giving
- goal
- Goes
- Group
- guide
- hand
- he
- helping
- hence
- here
- higher
- How
- How To
- HTML
- HTTPS
- Humans
- i
- I’LL
- idea
- if
- implement
- important
- in
- In other
- independence
- independent
- individual
- inertia
- inner
- input
- Interview
- interview questions
- Interviews
- into
- IT
- ITS
- just
- KDnuggets
- Know
- largest
- latest
- LEARN
- learning
- least
- leaves
- Library
- limits
- Line
- linear
- List
- losing
- loss
- lower
- machine
- machine learning
- Machines
- made
- Main
- make
- MAKES
- many
- Market
- matched
- Maximize
- maximizes
- mean
- meaning
- means
- measure
- measures
- Metrics
- Middle
- minimize
- minimizing
- ML
- ML algorithms
- model
- models
- more
- most
- naive
- name
- naturally
- Need
- neighbors
- New
- node
- nodes
- number
- observations
- of
- Oil
- on
- ONE
- only
- or
- Other
- Outcome
- outcomes
- overview
- own
- part
- patient
- patterns
- percentage
- perfect
- performance
- performs
- platform
- plato
- Plato Data Intelligence
- PlatoData
- Point
- points
- positioned
- positive
- possible
- Precision
- predict
- predicted
- predicting
- prediction
- Predictions
- Predictor
- Prepare
- previous
- Prices
- Principal
- principle
- principles
- priority
- probably
- Problem
- problems
- process
- Product
- Professor
- projects
- put
- Python
- Questions
- random
- ranges
- ratio
- Read
- real
- receives
- recognizing
- recommend
- reduces
- reducing
- refers
- regarding
- regression
- relatively
- repeated
- represented
- represents
- REST
- root
- s
- same
- Science
- Scientist
- scientists
- scikit-learn
- score
- separate
- serves
- set
- Shares
- should
- shown
- Shows
- similar
- simply
- So
- SOLVE
- some
- spam
- SQL
- Squared
- standard
- start
- Steps
- Still
- straight
- Strategy
- strive
- structure
- subsequent
- such
- sum
- supervision
- support
- SVG
- Take
- Talk
- Task
- tasks
- Teaching
- ten
- test
- than
- that
- The
- their
- then
- There.
- These
- they
- this
- threshold
- Through
- Thus
- to
- too
- top
- Top 10
- Total
- trained
- Training
- translate
- tree
- Trees
- Trends
- tries
- turing
- two
- type
- types
- understanding
- until
- use
- used
- uses
- using
- usually
- value
- Values
- variable
- variables
- vector
- very
- votes
- want
- we
- WELL
- What
- which
- while
- whole
- Wikipedia
- will
- with
- within
- without
- words
- workings
- works
- worse
- you
- Your
- zephyrnet