The nature of any sport is that consistency trumps all. A player’s ceiling is rendered irrelevant if they cannot reach it when their team needs them best. The greatest players of all time have high ceilings, but it is their floor that truly makes them stand out. Most tier one players have dropped 30 bombs; far fewer have strung together 20+ maps in a row above a 1.00 rating.
And it is the players who have ceilings as high as the game’s best but lack that floor that are so frustrating. Our eye tests remember their best games but not their average ones. Rather than being adorned with MVPs, these players are relegated to win conditions, labelled as hot-and-cold, as inconsistent players.
Chief among these players is Kristian “k0nfig” Wienecke. The Astralis entry fragger has dazzled as much as he has disappointed. That he held the CS:GO record for kills in regulation, going 47-21 against Renegades in 2018, shows the ceiling he can reach. In this iteration of Astralis, it is he and Benjamin “blameF” Bremer that are supposed to provide the starpower, yet k0nfig has fallen short of those expectations. His talent has been evident, as it always is, but consistency has eluded him.
So the narrative goes, anyway. But is it a fair one? Can we, fairly and objectively, measure a player’s inconsistency? Let’s find out, using stats from LAN in 2022.
To kick things off, we’ll start with a basic measure of map-to-map consistency: What percentage of maps a player finishes above a 1.00 rating. The average for our sample is just over 55%, so all of these players are above and beyond the pack.
However, this is far from perfect. A 1.01 rating might be a successful match for an average player, but for a star player or primary AWPer that might actually harm their team’s chances to win the match.

To see how much a player fluctuates compared to their own average rating, there’s a bit of mathematical jargon. We’ll be using standard deviation, which is a measure of variance. Basically, the lower the standard deviation, the more a player’s maps cluster around their mean rating. A high standard deviation, therefore, should indicate a level of inconsistency.
k0nfig, interestingly, doesn’t make the list of the top eight players with the highest standard deviation, placing in equal 17th at 0.327 standard deviation. The players that do make the list, however, are of his ilk. Vladislav “nafany” Gorshkov takes second at 0.377, another player who has come under fire for his inconsistency.

The mean rating on the table is different from the overall rating you’ll see on player profiles because it is an average rating per map, rather than per round
His high standard deviation shows why Cloud9 were so deadly at IEM Dallas, when nafany was in red-hot form, averaging a 1.14 rating (17 points higher than his year-long average).
Even within that event though, nafany‘s highs and lows were staggeringly different. Maps like 2.03 ratings against ENCE in the final and 2.16 in groups against Ninjas in Pyjamas were still coupled with 0.84 on map one against BIG and 0.79 and 0.91 ratings in two of the three maps against FaZe.
The story is the same for many of the players on this list. Fredrik “REZ” Sterner is another player to be labeled as inconsistent, and this metric seems to bear that out. Yuri “yuurih” Santos has endured tough spells in 2022 for their standards, while Andrei “arT” Piovezan is even more aggressive than nafany.
That Nikola “NiKo” Kovač has such a high rating and high standard deviation is also very illustrative of his year; his peaks have been as good as ever, but there have been times when G2 could have used more from their star man.
In NiKo‘s case, we can see a slight flaw in using standard deviation. If a player’s mean map-by-map rating is 1.26, is it really fair to call them inconsistent? Take this scatterplot, which compares a player’s mean rating with their standard deviation.

Joining NiKo in the high variance and high rating corner of the map is Dmitry “sh1ro” Sokolov, Mathieu “ZywOo” Herbaut, and Oleksandr “s1mple” Kostyliev. This rings alarm bells if we want to use this metric to establish inconsistency. For these players, they ‘deviate’ from their mean because they post carry-maps so often. A 2.00 rating is as much as 0.80 off one of these players’ mean ratings but is treated the same as a 0.60 rating for ‘inconsistency’ by standard deviation.
What is more interesting are the other sections. Riflers like Keith “NAF” Markovic, Russel “Twistzz” Van Dulken and Sergey “Ax1Le” Rykhtorov pair a low standard variation with high rating, showing that they are consistently in and around the 1.00-1.40 mark in their maps played. Audric “JACKZ” Jug is the player with the lowest standard deviation at just 0.24 as well as a fairly low mean of 0.96; he was consistently below average statistically this year.
This comparison also works for players with high variance and low ratings, with Alejandro “mopoz” Fernández-Quejo Cano, arT, Dan “apEX” Madesclaire and nafany slotting in near where we expected: Ultra-aggressive, X-factor, rifles. Yet, we will need a different solution for the very best players: The presence of s1mple and ZywOo in the top right proves that standard deviation is not good enough on its own to label a player as inconsistent.
One solution is to rank players by their floor, their bad maps, rather than their good ones. To do this we will be using the first quartile, or 25th percentile, of a player’s maps this year on LAN. The 25th percentile is a cousin of the median average except where the median is the middle value of an ordered list, the 25th percentile (often called Q1 in stats) is a quarter of the way through. For ease, when we use the term “floor” from here out we are referring to a player’s 25th percentile.
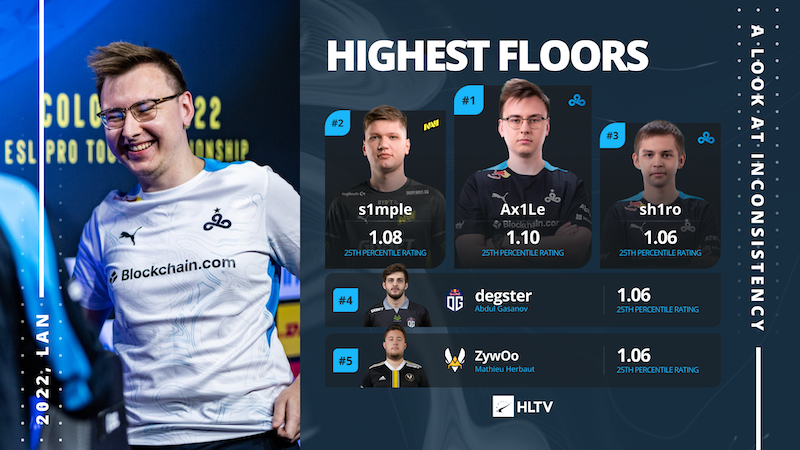
Now, we see those names that standard deviation treated unfairly in a different light. The floor for s1mple is a 1.08 rating, for ZywOo 1.06, and NiKo 1.01. Lurkers Ax1Le, NAF, and blameF are also in the top ten, perhaps in part due to their role allowing them to frag in their team’s losses as well as their wins.
This shows us who the most consistent players are, but what about inconsistent? If we just look at the players with the lowest floor, we get the likes of Epitacio “TACO” de Melo (0.64), Richard “shox” Papillon (0.67) and Rasmus “HooXi” Nielsen (0.69). Yet, this does not denote inconsistency in itself, since all these players had pretty bad average ratings.
To find the inconsistent players, we’re going to need our high school math textbooks again. By subtracting the floor (25th percentile) from the ceiling (75th percentile: The same as before, going three-quarters the way through of an ordered list) we get something called an inter-quartile range (IQR). This, like standard deviation, is a way to measure variance — think of it as the difference between a player’s good and bad maps — and should be more useful for our purposes.
Here’s a graphical explanation of the same stat. Each bar is one of k0nfig‘s maps on LAN in 2022, arranged from lowest to highest. Q1 is one-quarter of the way through, Q2 two quarters, and Q3 three quarters. Then we subtract Q1 from Q3 to give us the IQR.

With that explained, here are the players with the highest IQR:

NiKo is again featured, thanks in part again to his ridiculously high ceiling, something sh1ro also suffers from. Valeriy “b1t” Vakhovskiy and Lotan “Spinx” Giladi had a very good 2022, sharing a median rating of 1.15 but find themselves pretty high on this list. Spinx actually had a pretty good 0.98 rating as his floor; his high IQR is a result of his 1.45 rating ceiling, a huge 0.30 higher than his median rating. This puts him in the same camp as NiKo (1.50 ceiling), a comparison that has been made before and for good reason.
IQR is better than standard deviation, but we are still viewing numbers without their full context. To solve that, here’s a scatterplot that visualises a player’s floors at the same time as their ceiling. The size of each player’s dot corresponds to their inter-quartile range, which should help picture this further. Naturally, there is a lot of correlation between floor and ceiling but there are still points of interest in the players that stand out from the trend line.

The players in the orange and green bubbles have higher ceilings than they do floors, while those in the red and yellow have the vice versa. Now, players like NiKo and sh1ro are rewarded for their high ceilings, being placed in the green bubble of consistently good players. The very top right of the chart also illustrates the differences between Ax1Le and NAF, two players who had very similar standard deviation and IQR, with the Cloud9 man much further up and right than NAF.
Further left, we have the main ‘inconsistent’ orange bubble — the players who have high ceilings but fairly low floors. The majority of these players are fittingly orange dots, showing that they are aggressive riflers (with more than 20% opening kill attempts on T-side) which makes a lot of sense. These players, on a good day, can farm rating with high-impact entry frags and multi-kills. On their bad days, however, their survival rate tumbles, leaving them in the red.
Boris “magixx” Vorobiev is the biggest outlier here, somewhat surprisingly. On his good days he is rated as highly as b1t and Mareks “YEKINDAR” Gaļinskis but he has a floor lower than Andreas “Xyp9x” Højsleth. Joining him are more of who you would expect: nafany, Hampus “hampus” Poser, Fredrik “roeJ” Jørgensen, and Michael “Grim” Wince are all aggressive X-factors rather than consistent forces. Asger “Farlig” Jensen is the AWPer with the lowest floor in our sample, which fits with the narrative around the Dane.
Here, we have presented three different ways to look at inconsistency: standard deviation, inter-quartile range, and the ‘orange zone’ in our scatterplot (those players with a low rating in bad maps but a strong one on their good days). All have their flaws when used in isolation, so let’s now combine the different methods for an ‘inconsistency rating’ formula.
To recap, we’re taking into account:
— Percentage of maps with 1.00+ rating
— Standard deviation
— Inter-quartile range (Q3-Q1)
— Difference between a player’s average and floor (Q2-Q1)
— Difference between a player’s average and ceiling (Q3-Q2)
Here’s a list of players with the highest inconsistency rating, to give the most ‘inconsistent’ players. Remember, though, that this is consistency compared to a player’s average rating; these players are consistently around their average, not consistently good. Only about 20% of the formula is related to being a ‘good’ player statistically, in that players are awarded inconsistency rating for having a low percentage of maps above 1.00.

While k0nfig is absent — and b1t has rarely been accused of inconsistency on desks — the list as a whole seems to match with the eye test and community narratives. nafany, mopoz and apEX are all archetypes of the explosive yet inconsistent players that have cropped up throughout this piece, the very same archetype k0nfig is part of.
So, have we solved the great ‘inconsistency’ question? Sort of — but there are still holes. And, as we said in the introduction, proper consistency will elude 99% of professional players. The narrative around k0nfig and REZ being inconsistent is probably based on the idea that these players should be consistent, given their obvious talent and mechanical skill on the eye test.
When we look at a bigger sample, however, we can see that the vast majority of riflers suffer from the same problem. NiKo had three months at the back end of 2021 where he was as good as anyone in the world — even the AWPers. Now, though, he has fallen back into ‘just’ being the best rifler in the world. When we flip the list to give us the least inconsistent players, it is a collection of AWPers and supportive, more passive, riflers.

In a game as difficult as CS:GO, off-days and bad patches are inevitable. But, it is clear that some players have better off-days than others. And, as we said in the introduction, this only makes the players who can put up 1.00+ ratings on bad days more valuable, especially those who do take a lot of opening duels like Ax1Le and NiKo.
The problem is that those two players are the only aggressive riflers who have put up a floor higher than 1.00 on LAN so far this year. Just eight others managed that feat — five of them being primary AWPers — which is a tiny fraction of the professional playerbase. True consistency at a high level is every sport’s El Dorado, and Counter-Strike is no different.
For similar deep-dive articles, check out the links below:

Read more
Is the modern AWPer really too passive?
Read more
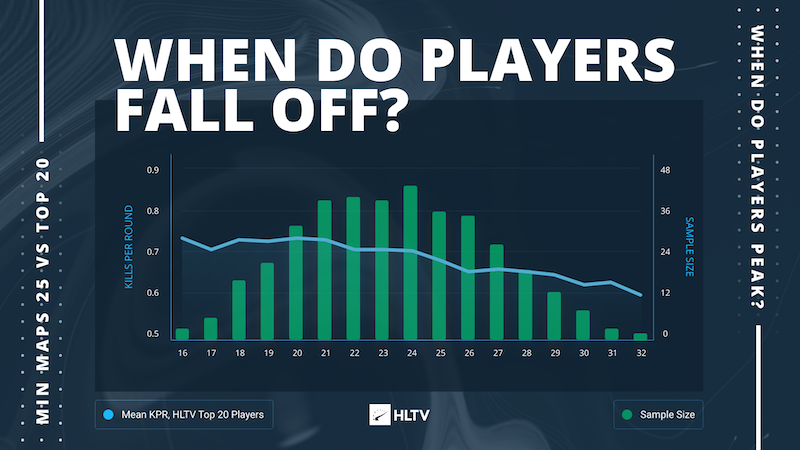
When do Counter-Strike players peak?

Read more
Expert take: Age and motivation in Counter-Strike

Read more
Why are modern IGLs so aggressive?

Read more
Is double AWPing worth it?

Read more
Who are CS:GO’s map specialists?

Read more
What are CS:GO’s easiest and hardest CT positions?

Read more
What are CS:GO’s easiest and hardest T-sided positions?

Read more
We paired current and former academy players with their top tier doppelgängers

Read more
Should rosters be given more time?
- alpha metaverse
- battlebots
- blockchain
- blockchain conference esports
- coingenius
- crypto conference esports
- esport games
- esporta
- esporta app
- esporta fitness
- esports
- evil geniuses
- games with esports
- globo esporte
- HLTV
- loco esports games
- metaverse esport games
- national sports week
- plato
- plato ai
- Plato Data Intelligence
- Plato Game
- PlatoData
- platogaming
- simplicity esports
- spasm esports games
- steam esports games
- team solomid
- top esports games
- tundra esports
- twitch esports games
- zephyrnet