Published 2 days ago
For nearly a month, the AAVE price has been rising under the influence of an inverted flag pattern. The current bear cycle within this pattern has plummeted the coin price to the $69.5 mark and is gradually nearing the support trendline. A possible breakdown from the trendline would sink the altcoin to $46.1 support.
advertisement
Key points:
- The AAVE price may drop another 8.5% before testing the pattern’s support trendline.
- The MACD indicator teases a potential bearish crossover below the neutral line.
- The intraday trading volume in AAVE/USD is $318.5 Million, indicating a 47% gain.
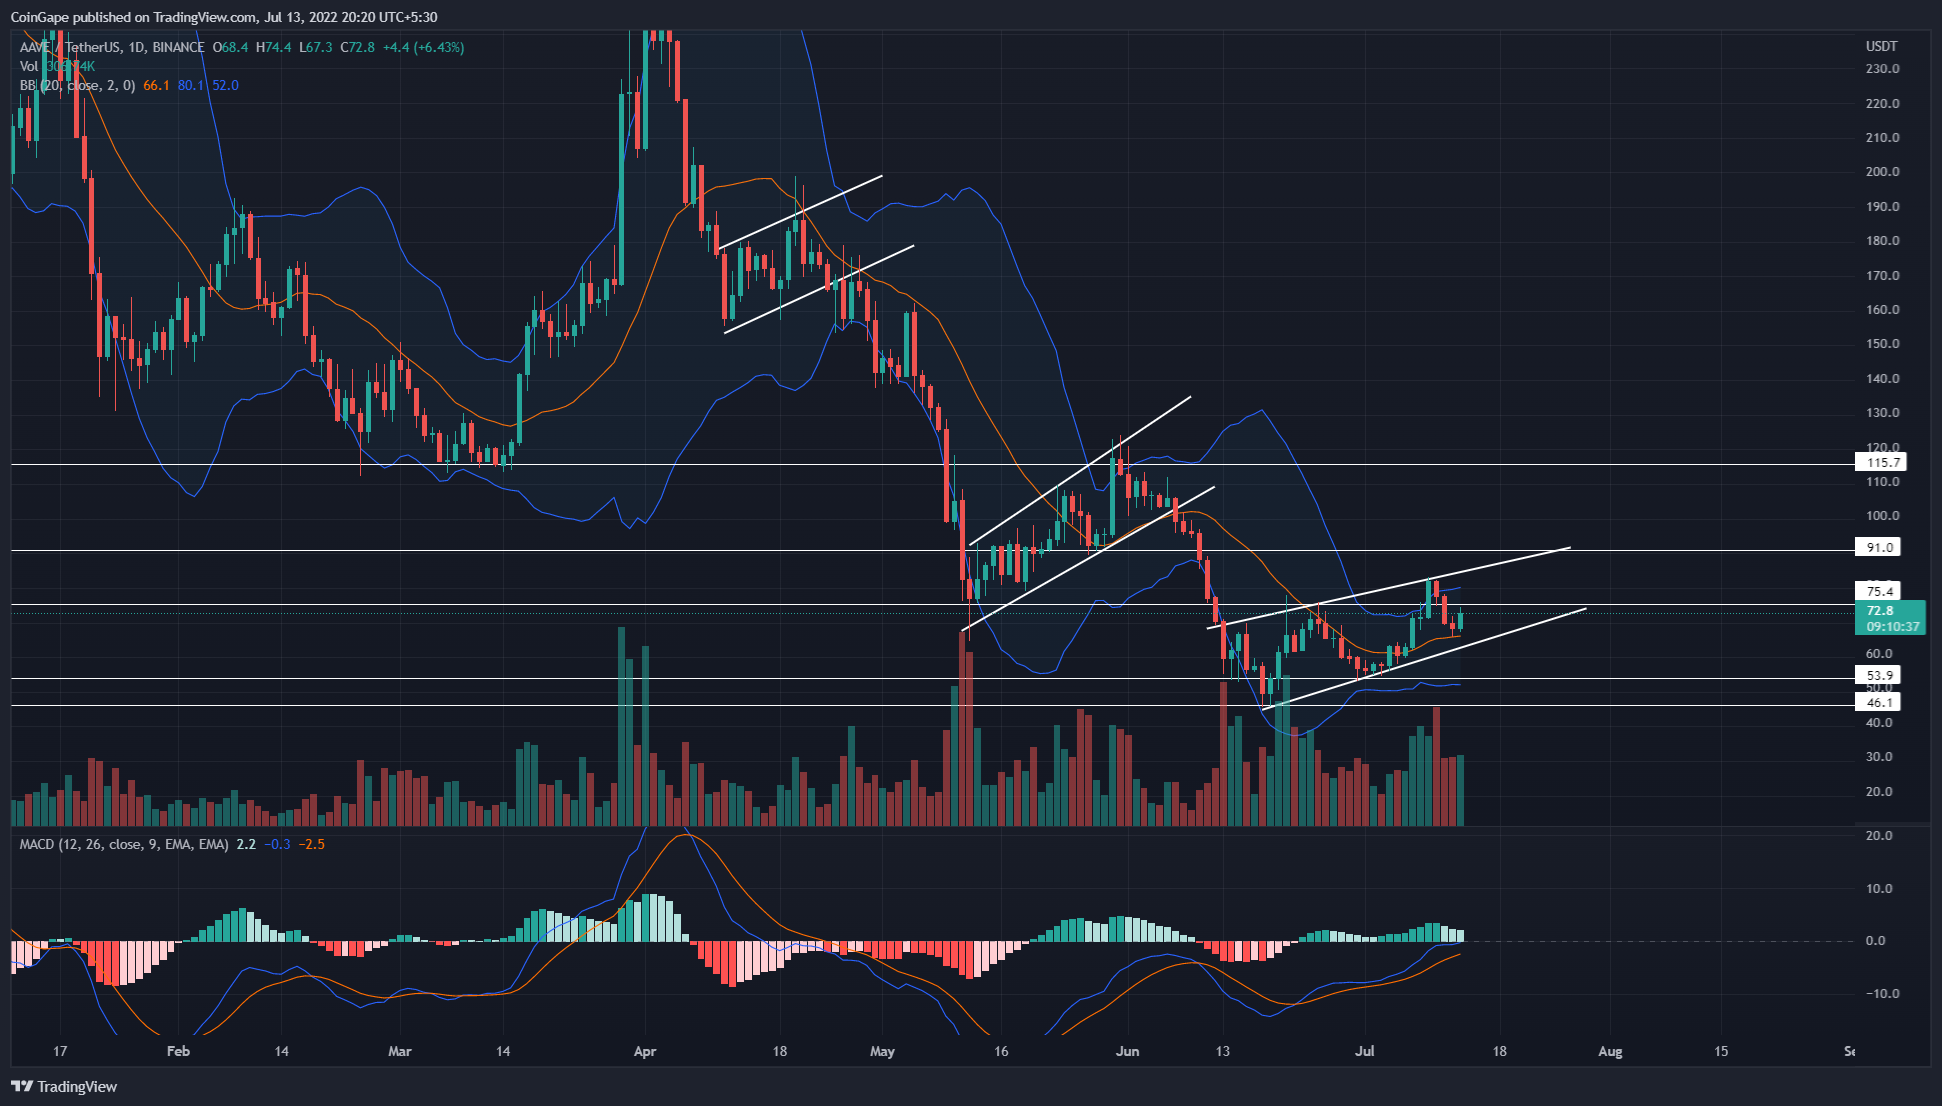
Source- Tradingview
The AAVE/USDT technical chart shows the ongoing downtrend following a particular pattern before releasing the stored selling pressure. This pattern is determined as an inverted flag in technical analysis and is known to bolster the prevailing downtrend.
The AAVE chart showed this bearish continuation pattern in April’s second half, which triggered the late-April to the early-May bloodbath. Moreover, the same pattern was observed from mid-May to early June, which initiated June’s second-week sell-off.
Trending Stories
Thus, on June 19th, the AAVE price bounced back from the $46.1 low and began a fresh recovery rally. The altcoin rising with new higher highs showcased the formation of another inverted flag pattern.
On July 10th, the coin price faced its third reversal from the pattern’s resistance trending, which plunged it 18.7% in the last four days.
Furthermore, this bearish reversal has breached horizontal support of $75, which should continue the downfall to the bottom trendline. If the selling pressure persists, the AAVE price may slice through the support trendline, signaling another sell-off.
The expected fall should hit the 33% down June low support of $46.1.
Technical indicator
MACD indicator: the fast and slow line nearing a bearish crossover just below the neutral zone bolsters the ongoing price drop to breach the support trendline.
advertisement
Bollinger Band indicator: a recent fakeout from the indicator’s upper band indicates the sellers still hold a firm grip over this coin. Moreover, a breakdown from the midline would offer an extra edge for sellers.
- Resistance levels: $75.4 and $91
- Support levels: $54 and $46.1
Share this article on:
The presented content may include the personal opinion of the author and is subject to market condition. Do your market research before investing in cryptocurrencies. The author or the publication does not hold any responsibility for your personal financial loss.
- aave
- Aave Price Analysis
- Bitcoin
- blockchain
- blockchain compliance
- blockchain conference
- coinbase
- Coingape
- coingenius
- Consensus
- crypto conference
- crypto mining
- cryptocurrency
- decentralized
- DeFi
- Digital Assets
- ethereum
- machine learning
- non fungible token
- plato
- plato ai
- Plato Data Intelligence
- Platoblockchain
- PlatoData
- platogaming
- Polygon
- Price Analysis
- proof of stake
- W3
- zephyrnet