The price of Bitcoin looks cheap for many traders and investors as the price of the highest cryptocurrency by market capitalization possesses the strength to 10X its value in the coming months as Bitcoin’s halving continues to knock hard on the doors of the cryptocurrency market.
Michael Saylor, MicroStrategy co-founder and Bitcoin bull, believes Bitcoin has all that it takes to 10X, considering its halving could be a huge catalyst to its price as MicroStrategy remains a huge advocate of Bitcoin as it has maintained strong bullish scenarios for Bitcoin during its bearish run.
During Bitcoin’s bearish run to a low of $15,500, MicroStrategy continued to buy into Bitcoin assets using the dollar cost averaging method (DCA) to build a bullish position on this great asset as it believes Bitcoin remains a haven.
Bitcoin’s (BTC) price action in recent months and weeks, rallying high to a region of $37,500, has highlighted much bullish price action and curiosity for many traders, investors, and veteran traders speculate this could be the initial phase of Bitcoin’s bullish run to its all-time high.
– Advertisement –
After experiencing a prolonged bear market for over two years, many traders and investors lost faith in Bitcoin, considering the bear market to be unusual compared to previous ones. The price of Bitcoin has demonstrated a glimpse of its price action as there has been much excitement in the crypto market.
The monthly heat map for the top 100 cryptocurrencies has shown bullish price action, with the likes of Bitcoin (BTC), Ethereum (ETH), and Solana (SOL) all seeing a price rally of 38%, 32%, and 169% respectively as many weekly top 5 cryptos (XRP, DOGE, SOL, YFI, AVAX) gears up for many rallies.
The euphoria surrounding the cryptocurrency market at this initial stage of Bitcoin and other weekly top 5 cryptocurrencies (XRP, DOGE, SOL, YFI, AVAX) rally gives much evidence to bulls remaining much in control of prices in the market as other smaller altcoins outshine major cryptos.
Bitcoin’s price action has remained evident across the cryptocurrency market, highlighting many activities on the Bitcoin network with its active addresses for the past month continuing to rise, hitting new yearly highs compared to previous months where Bitcoin suffered less volatility to the upside.
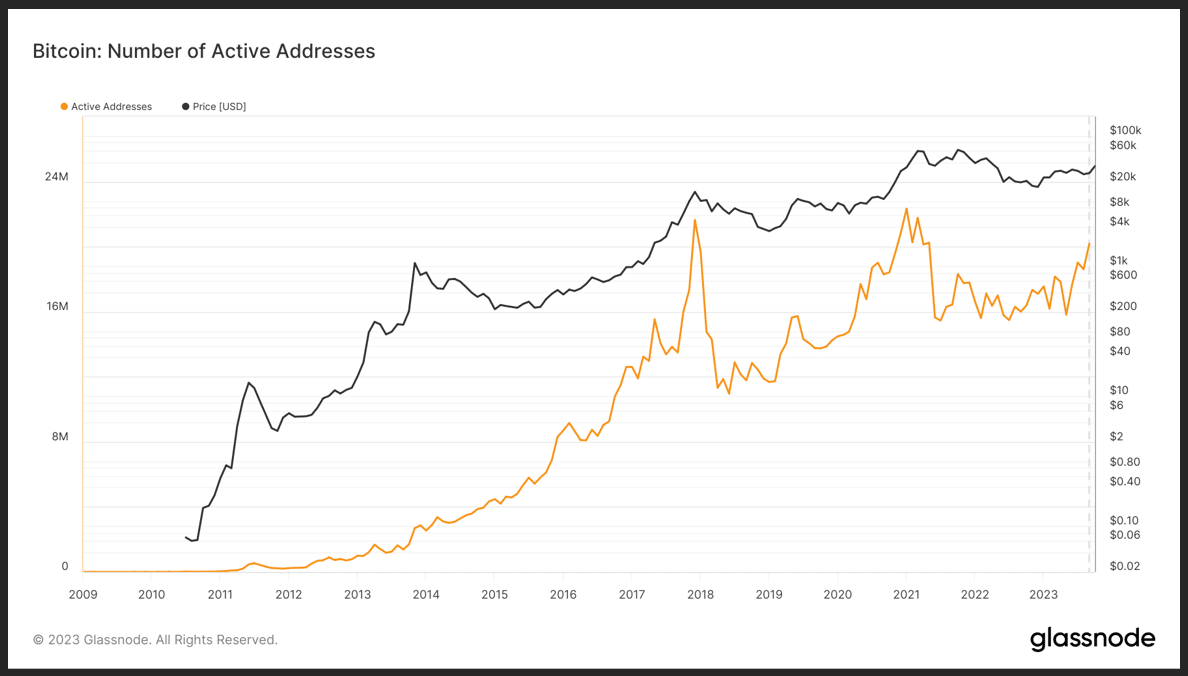
The image above from Glassnode highlights Bitcoin’s active addresses rising to a new yearly high as this shows many activities on the Bitcoin network as price gears up for much rally leading up to its impending halving that has raised much enthusiasm for traders and investors looking to make good return on Bitcoin and other top 5 weekly cryptos (XRP, DOGE, SOL, YFI, AVAX).
The major rally for Bitcoin in recent months has been accredited to its Bitcoin spot ETF (BTC spot Exchange-traded Fund) rumored approval, which is not far off from the truth, with many traders and investors speculating Bitcoin spot ETF would soon be approved and could be a double booster for price.
A recent report from the United States Securities and Exchange Commission (US SEC) states that the US SEC has entered into talks with Grayscale, a top crypto asset manager, regarding the Bitcoin spot ETF application, as many believe approval would be what the market needs for a bullish run.
The price of Bitcoin remains a key figure in the current price action in the cryptocurrency market after the price of Bitcoin broke and closed above the key resistance of $32,500 as the price reclaimed the high of $34,000 forming a good support above $32,000, many traders and investors as a pullback to this region would be opened for more buy orders.
Bitcoin’s price flipping its resistance of $32,000 into support has remained much welcomed. The price has rallied to a high of $37,800 before experiencing a minor price decline to $37,100 as the price of Bitcoin and other cryptocurrency assets head into the weekend with low volume.
The price of Bitcoin remains bullish on the low and higher timeframes after a successful close above $34,000 on the monthly and weekly candle as the price could aim to retest the highs of $38,000 to $40,000, which remains an area of supply for price.
Bitcoin’s price continues to look bullish as price trades above the 50-day, 100-day, and 200-day Exponential Moving Averages (50-day, 100-day, and 200-day EMAs) for the first time in months since the start of its bear market.
Many indicators, such as the Moving Average Convergence Divergence and Bollinger Bands, all indicate a bullish price trend and a shift from bearish to bullish price movement as the coming weeks remain favorable for altcoins.
Despite the market looking bullish across the board, Ethereum’s price has remained a worry as the price struggled to break $2,000 after being outperformed by weekly top 5 cryptos (XRP, DOGE, SOL, YFI, AVAX), including Bitcoin.
Ethereum’s price performing well would boost altcoins as the current total market capitalization, excluding Bitcoin, is above 660 Billion. In contrast, the total market capitalization continues to rally above 1.3 Trillion, still short of its 3 Trillion from the last bull market.
Let’s discuss some of the weekly top 5 cryptos (XRP, DOGE, SOL, YFI, AVAX) and how they will perform in the coming days and as a new week provides more opportunities for traders and investors.
Ripple (XRP) Daily (1D) Price Analysis as a Weekly Top 5 Crypto to Watch
The price of Ripple (XRP) failed to replicate its price as its on-chain data and trading activities continued to soar high as the price of XRP/USDT faced another rejection around $0.72, preventing the price from rallying higher.
Ripple’s on-chain data suggest that the price should have rallied higher than its current price action, as many analysts and investors believe XRP/USDT could be a game changer in the current bull market despite its slow response in price action.
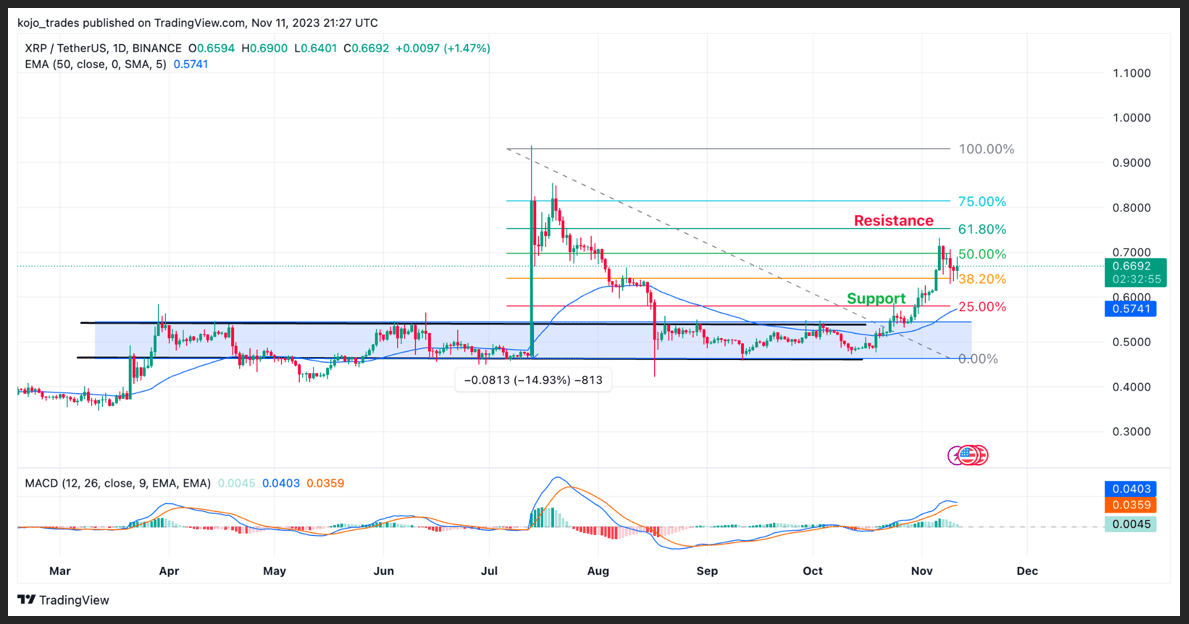
The price action of XRP/USDT looked encouraging as compared to previous weeks after breaking out above $0.6 as the price of XRP/USDT rallied to a high of $0.72 above its 38.2% Fibonacci Retracement value (38.2% FIB Value) acting as resistance for its old price.
Ripple reclaimed its price above $0.66, forming a good support above this region as the price would be looking to break and close above $0.8. A break and close above $0.8 for the XRP/USDT price would mean a bullish price action as the price will rally to $1.
The price of XRP/USDT on the daily timeframe looks bullish as its Moving Average Convergence Divergence (MACD) and its Relative Strength Index (RSI) all point to bullish price dominance.
Ripple’s price trades above its 50-day EMA, corresponding to its 25% FIB value of around $0.55, acting as a strong support and demand zone for XRP/USDT price.
Major XRP/USDT support zone – $0.55
Major XRP/USDT resistance zone – $0.75
MACD trend – Bullish
Dogecoin (DOGE) Price Chart Analysis as a Top 5 Crypto
The cryptocurrency market has been performing beyond expectations, with many altcoins rallying to over 300%. Fundamental and technical analysis shows that this could end the bear market as many traders and investors want to invest in top memecoins like Dogecoin (DOGE).
Despite the market looking considerably favorable for many traders and investors as they buy into many bullish altcoins, there has been a slow price movement for some altcoins, such as DOGE/USDT, as the price struggles to overcome its resistance preventing its price from a major price rally.
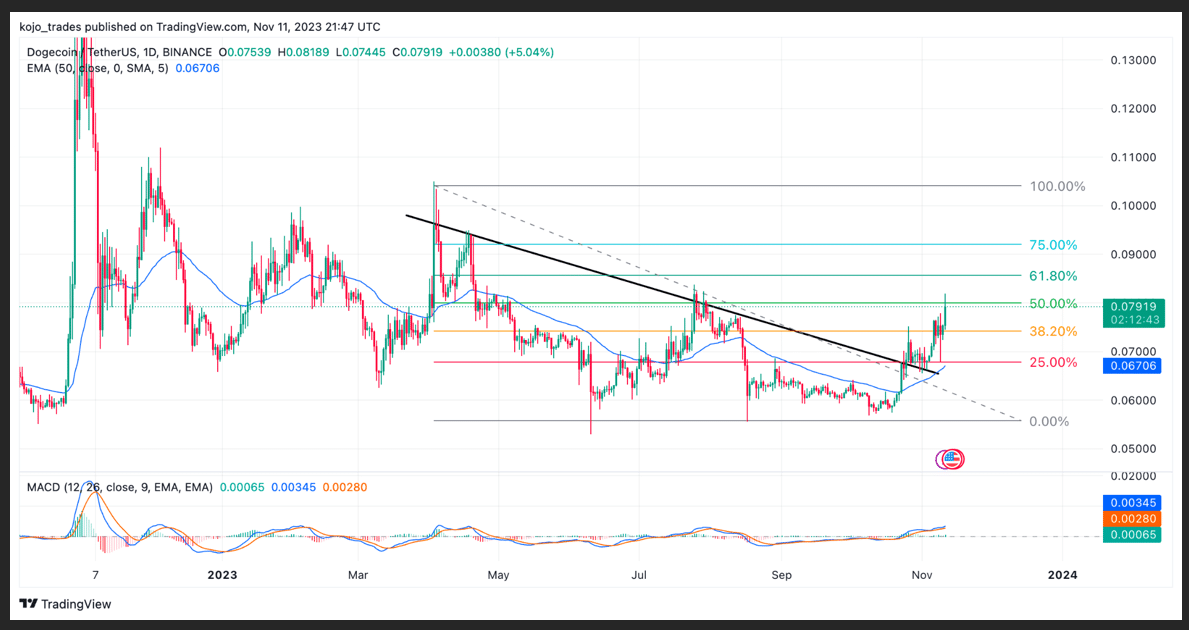
DOGE/USDT has had a tough time during the bear market, dropping from its all-time high of $0.7 to a yearly low of $0.055 as price found a demand zone where price bounced off quickly to trend higher.
The price of DOGE/USDT ranged for some months as the price struggled to maintain a bullish price action as bears continued to dominate its price. After weeks of range-bound movement, the price of DOGE/USDT broke out of its downtrend range.
DOGE/USDT reclaimed its price above its key level of 25% FIB value and 50-day EMA, as this region supports a price of $0.065. Since its formation above this region, the price of DOGE/USDT looks prime for a rally.
Dogecoin currently faces resistance at $0.085; a break and close above this region would see a price rally to $0.1 and possibly $0.15 as its daily MACD and RSI indicators show bullish price movement.
Major DOGE/USDT support zone – $0.065
Major DOGE/USDT resistance zone – $0.085
MACD trend – Bullish
Solana (SOL) Price Chart Analysis on the Daily (1D) Timeframe
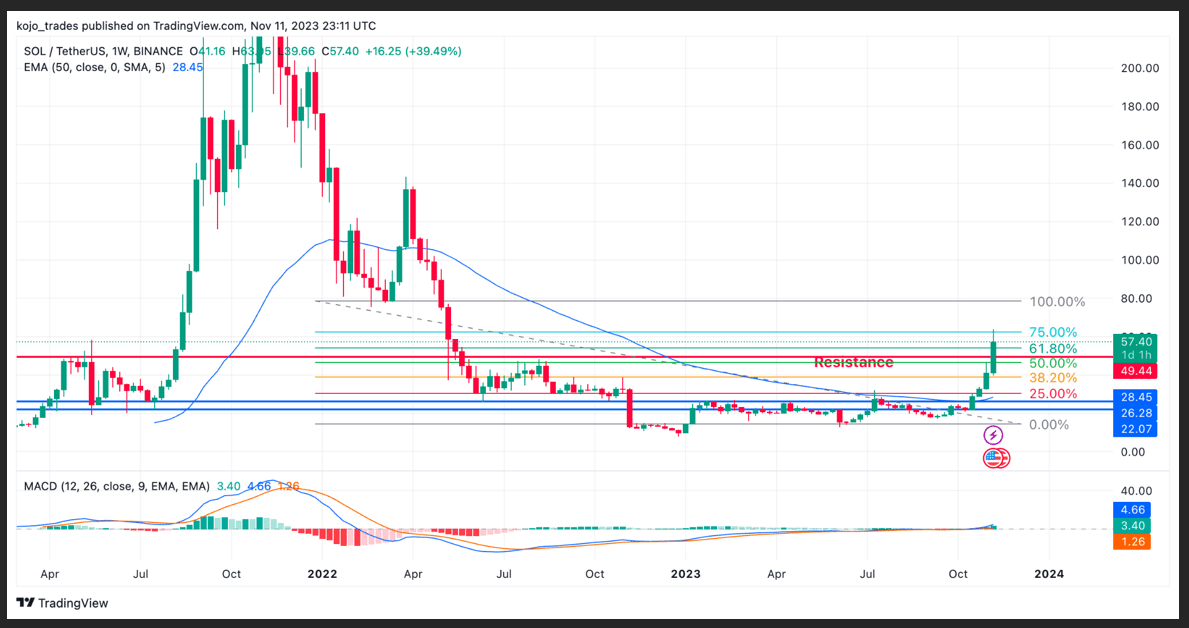
Solana has remained one of the best-performing cryptocurrencies despite its price dropping from $220 to a yearly low of $12. The price of SOL/USDT has been undoubtedly one of the best-performing altcoins for 2023 and October and November 2023, as the price has gained over 160% in 30 days.
The price of SOL/USDT struggled for the larger part below $30 as the price remained in a range-bound movement, trying to break past this key region, acting as resistance for the price as bears rejected the previous attempt.
After a successful breakout and close above $32, corresponding to the 25% FIB value just above the 50-day EMA, the price of SOL/USDT has demonstrated a much more bullish price rally, outperforming BTC and ETH.
There is still high speculation of the price of SOL/USDT rallying to $80 and $100 if the price exceeds $65 as this region continues to reject bulls from rallying higher.
The RSI and MACD for SOL/USDT on the daily and weekly time frame both look bullish as the price would rally higher or experience a minor decline in price to $52, acting as a support region for price.
Major SOL/USDT support zone – $52
Major SOL/USDT resistance zone – $65-$80
MACD trend – Bullish
Yearn Finance (YFI) Price Chart Analysis
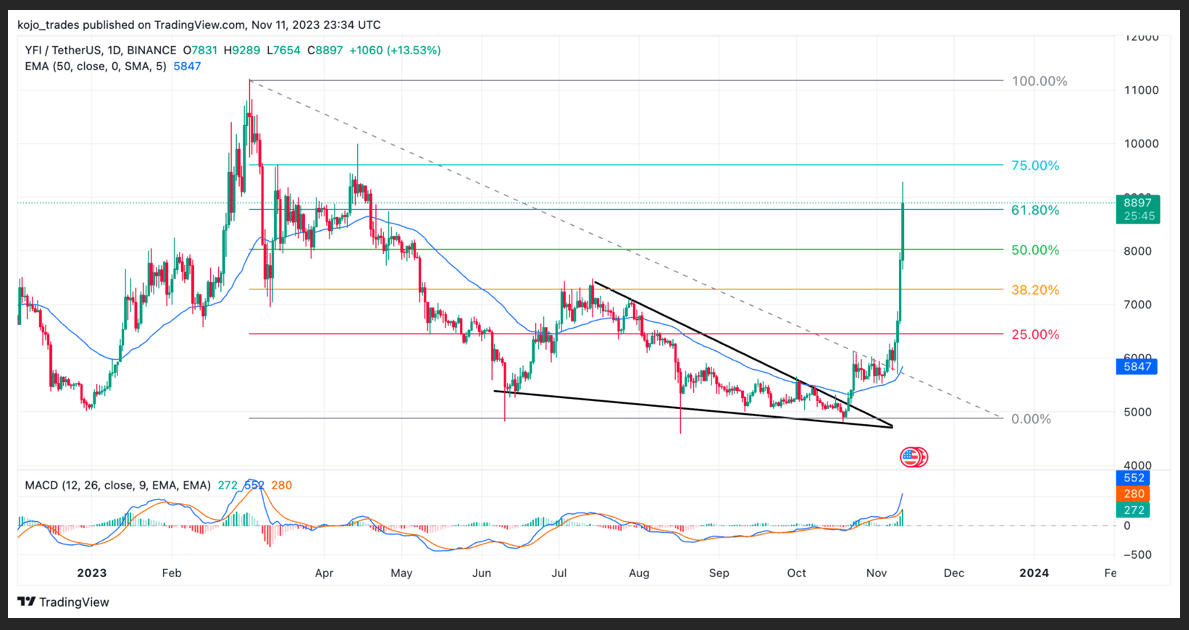
Yearn Finance (YFI) remains a huge player in the cryptocurrency market as it has contributed immensely to the DeFi space in the past bull market, rallying from a region of $1,500 to a high of $95,000 before suffering a shock price decline as a result of the crypto bear market.
After dropping to its yearly low of $4,500, the price of YFI/USDT has struggled to maintain a strong bullish price action as bears dominated the price. The price of YFI rallied from its low to a high of $11,000 but was quickly rejected by bears as the price remained in a downtrend.
With the crypto market looking bullish, the price broke out of its downtrend price movement to the upside after forming a bullish descending triangle. The price rallied with much momentum to a high of $9,000, trading above its 50-day EMA and 50% FIB value.
The price action for YFI/USDT on lower and higher timeframes looks bullish as its RSI and MACD all indicate bullish price dominance as price eyes a rally to a high of $12,000 in the coming days.
Major YFI/USDT support zone – $7,300
Major YFI/USDT resistance zone – $9,000
MACD trend – Bullish
Avalanche (AVAX) Price Chart Analysis as a Top 5 Weekly Crypto
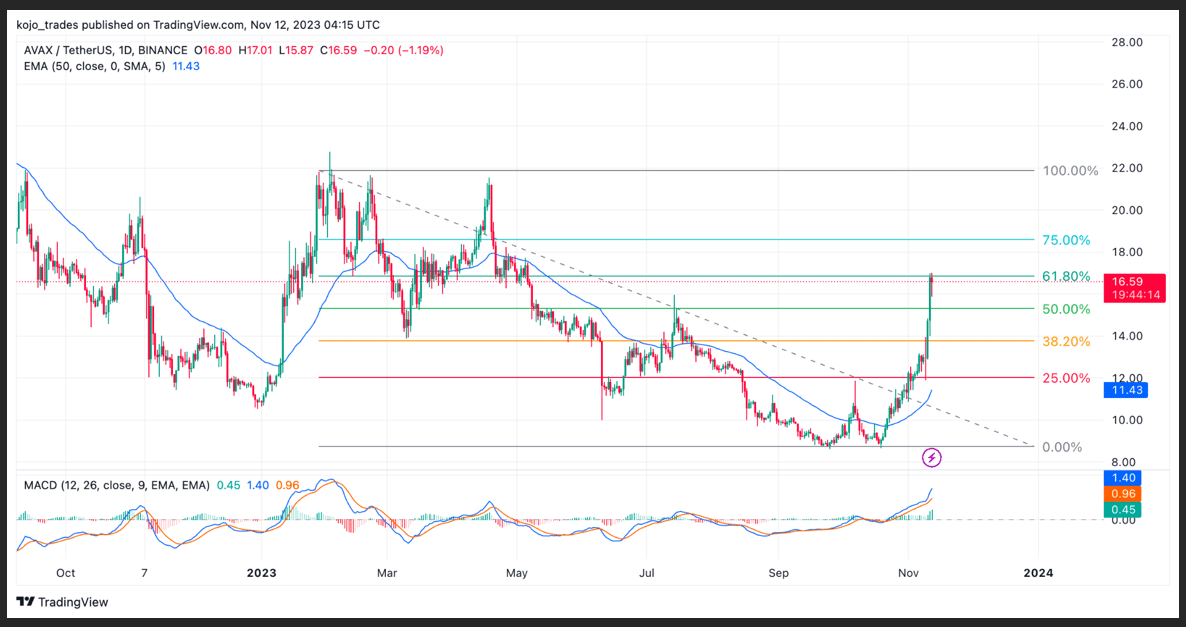
Avalanche (AVAX) remains one of the top performing projects in the last bull market, rallying to a high of over $140, but has suffered much price decline in the bear market as its price dropped to a yearly low of $9 where price formed a demand zone or support.
The price of AVAX/USDT dropped to $9, forming a double bottom as demand for price increased, pushing the price of AVAX/USDT from that region to a high of $12, where the price struggled to break out further.
AVAX’s price at $12 corresponded with a 25% FIB value acting as resistance as the price flipped this region to trend higher, considering how bullish the crypto market has been lately.
The price of AVAX/USDT broke above $13.75, forming a strong support above the 50-day EMA as price eyes a bullish rally to a high of $22 in the coming days and weeks as its daily and weekly timeframes chart remains bullish.
The price of AVAX/USDT remains strong as its daily RSI and MACD indicate strong buy volume for AVAX/USDT and bullish price action as the price could continue its movement higher.
Major AVAX/USDT support zone – $15.3
Major AVAX/USDT resistance zone – $22
MACD trend – Bullish
Follow Us on Twitter and Facebook.
Disclaimer: This content is informational and should not be considered financial advice. The views expressed in this article may include the author’s personal opinions and do not reflect The Crypto Basic’s opinion. Readers are encouraged to do thorough research before making any investment decisions. The Crypto Basic is not responsible for any financial losses.
-Advertisement-
- SEO Powered Content & PR Distribution. Get Amplified Today.
- PlatoData.Network Vertical Generative Ai. Empower Yourself. Access Here.
- PlatoAiStream. Web3 Intelligence. Knowledge Amplified. Access Here.
- PlatoESG. Carbon, CleanTech, Energy, Environment, Solar, Waste Management. Access Here.
- PlatoHealth. Biotech and Clinical Trials Intelligence. Access Here.
- Source: https://thecryptobasic.com/2023/11/12/altcoins-rally-weekly-top-5-cryptos-to-watch-xrp-doge-sol-yfi-avax/?utm_source=rss&utm_medium=rss&utm_campaign=altcoins-rally-weekly-top-5-cryptos-to-watch-xrp-doge-sol-yfi-avax
- :has
- :is
- :not
- :where
- $UP
- 000
- 1
- 1.3
- 100
- 11
- 15%
- 2%
- 2023
- 30
- 500
- 66
- 7
- 72
- 75
- 8
- a
- above
- accredited
- across
- acting
- Action
- active
- activities
- addresses
- Advertisement
- advice
- advocate
- After
- aim
- All
- Altcoins
- an
- analysis
- and
- Another
- any
- Application
- approval
- approved
- ARE
- AREA
- around
- article
- AS
- asset
- Assets
- At
- attempt
- author
- AVAX
- average
- averaging
- basic
- BE
- Bear
- Bear Market
- bearish
- Bears
- been
- before
- being
- believe
- believes
- below
- Beyond
- Billion
- Bitcoin
- Bitcoin bull
- Bitcoin Network
- Bitcoin spot etf
- board
- Bollinger bands
- boost
- booster
- both
- Bottom
- Break
- break out
- Breaking
- breakout
- Broke
- BTC
- build
- bull
- Bull Market
- Bullish
- Bulls
- but
- buy
- by
- capitalization
- Catalyst
- Changer
- Chart
- cheap
- Close
- closed
- Co-founder
- coming
- coming weeks
- commission
- compared
- considerably
- considered
- considering
- content
- continue
- continued
- continues
- continuing
- contrast
- contributed
- control
- Convergence
- corresponded
- Corresponding
- Cost
- could
- crypto
- crypto asset
- Crypto bear market
- Crypto Market
- cryptocurrencies
- cryptocurrency
- Cryptocurrency Assets
- cryptocurrency market
- cryptos
- curiosity
- Current
- Currently
- daily
- data
- Days
- Dca
- decisions
- Decline
- DeFi
- Demand
- demonstrated
- descending triangle
- Despite
- discuss
- Divergence
- do
- Doge
- DOGE/USDT
- Dogecoin
- Dogecoin (DOGE)
- Dollar
- Dominance
- dominate
- doors
- double
- double bottom
- dropped
- Dropping
- during
- EMA
- encouraged
- encouraging
- end
- entered
- enthusiasm
- ETF
- ETH
- Ether (ETH)
- ethereum
- ethereum (ETH)
- Ethereum's
- evidence
- evident
- exceeds
- exchange
- Exchange Commission
- exchange-traded
- Excitement
- excluding
- expectations
- experience
- experiencing
- exponential
- expressed
- Eyes
- faced
- faces
- Failed
- faith
- far
- favorable
- Fibonacci
- Figure
- finance
- financial
- financial advice
- First
- first time
- For
- formation
- formed
- found
- FRAME
- from
- fund
- fundamental
- further
- gained
- game
- game-changer
- gears
- gears up
- gives
- Glassnode
- Glimpse
- good
- Grayscale
- great
- had
- Halving
- Hard
- Have
- haven
- head
- High
- higher
- highest
- Highlighted
- highlighting
- highlights
- Highs
- hitting
- How
- http
- HTTPS
- huge
- ID
- if
- image
- immensely
- impending
- in
- include
- Including
- increased
- index
- indicate
- Indicators
- Informational
- initial
- into
- Invest
- investment
- Investors
- IT
- ITS
- just
- Key
- key resistance
- larger
- Last
- lately
- leading
- less
- Level
- like
- likes
- Look
- looked
- looking
- LOOKS
- losses
- lost
- Low
- lower
- MACD
- maintain
- major
- make
- Making
- manager
- many
- map
- Market
- Market Capitalization
- max-width
- May..
- mean
- Memecoins
- method
- MicroStrategy
- minor
- Momentum
- Month
- monthly
- months
- more
- movement
- moving
- moving average
- moving averages
- much
- needs
- network
- New
- November
- october
- of
- off
- Old
- on
- On-Chain
- on-chain data
- ONE
- ones
- opened
- Opinion
- Opinions
- opportunities
- or
- orders
- Other
- out
- outperformed
- outperforming
- over
- Overcome
- part
- past
- perform
- performing
- personal
- phase
- plato
- Plato Data Intelligence
- PlatoData
- player
- Point
- position
- possesses
- possibly
- preventing
- previous
- price
- PRICE ACTION
- Price Analysis
- price chart
- price rally
- Prices
- Prime
- projects
- provides
- pullback
- Pushing
- quickly
- raised
- rallies
- rally
- range
- readers
- recent
- reflect
- regarding
- region
- Rejected..
- relative
- relative strength index
- Relative Strength Index (RSI)
- remain
- remained
- remaining
- remains
- report
- research
- Resistance
- response
- responsible
- result
- retracement
- return
- Ripple
- Ripple (XRP)
- Rise
- rising
- rsi
- Run
- s
- Saylor
- scenarios
- SEC
- Securities
- Securities and Exchange Commission
- see
- seeing
- shift
- Short
- should
- show
- shown
- Shows
- since
- slow
- smaller
- SOL
- Solana
- Solana (SOL)
- some
- Soon
- Space
- speculation
- Spot
- spot etf
- Stage
- start
- States
- Still
- strength
- strong
- Struggles
- successful
- such
- suffered
- suffering
- suggest
- supply
- support
- Supports
- Surrounding
- TAG
- takes
- Talks
- Technical
- Technical Analysis
- than
- that
- The
- The Crypto Basic
- The Weekly
- There.
- they
- this
- time
- timeframe
- to
- top
- top 5
- Total
- tough
- Traders
- trades
- Trading
- Trend
- Trillion
- truth
- trying
- two
- undoubtedly
- United
- United States
- unusual
- Upside
- us
- US Sec
- USDT
- using
- value
- views
- Volatility
- volume
- W3
- want
- was
- Watch
- webp
- week
- weekend
- weekly
- Weeks
- welcomed
- WELL
- What
- which
- will
- with
- worry
- would
- xrp
- XRP/USDT
- yearly
- years
- YFI
- YFI/USDT
- zephyrnet