The Bitcoin dominance rate (BTCD) has been increasing since bouncing at the long-term support area of 39.50% in the beginning of May.
However, it broke down from an ascending wedge on Aug. 10, potentially signaling the beginning of a downward trend.
Long-term descent
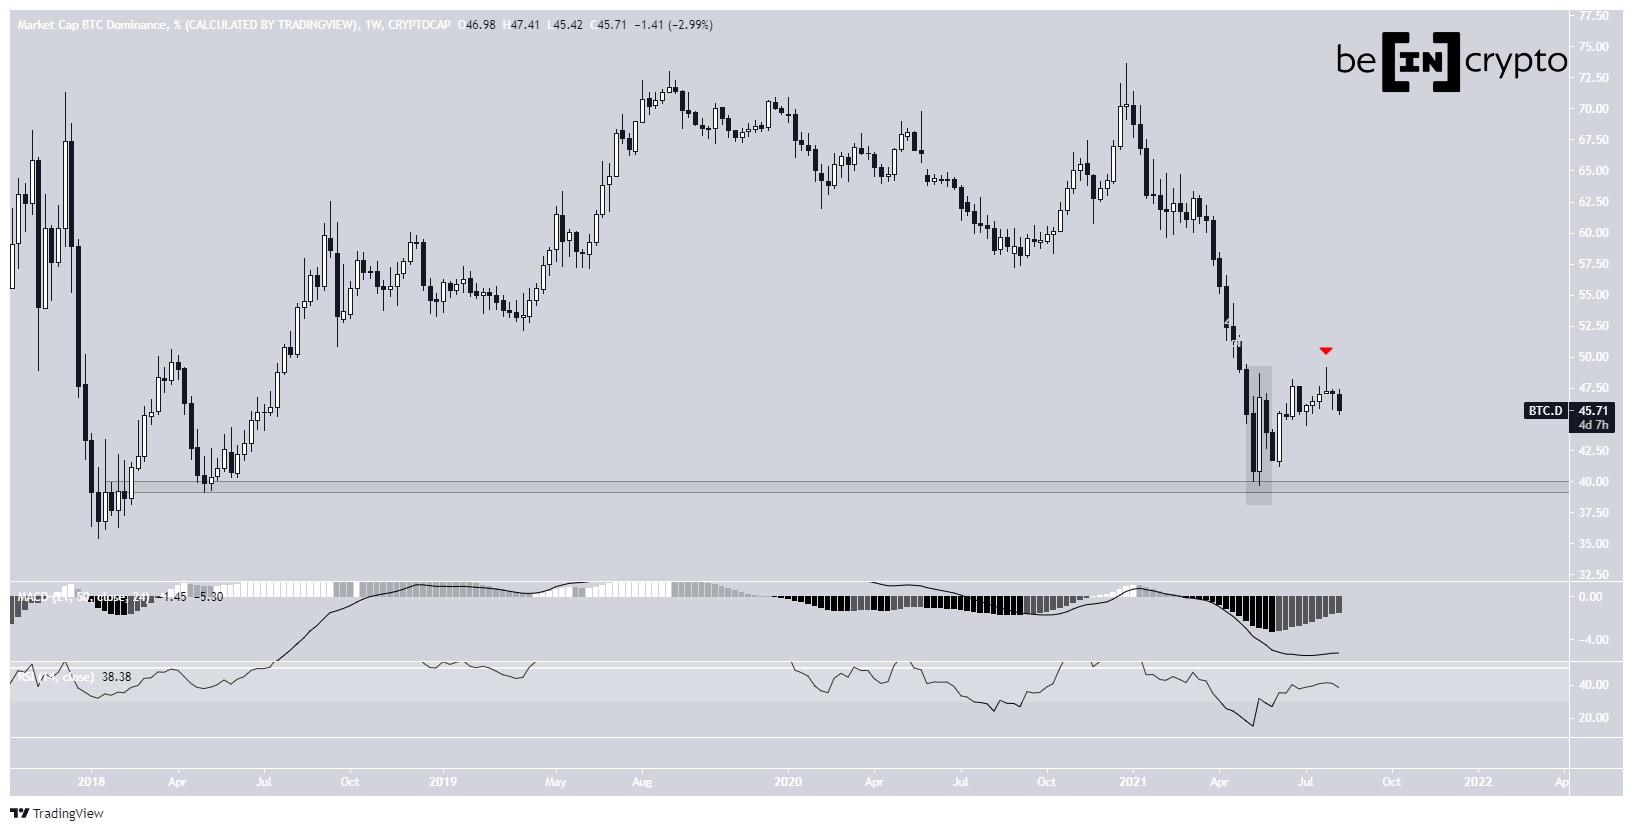
BTCD has been moving downwards since reaching a high of 73.63% in Jan. 2021. The decrease continued until a low of 39.66% was reached in May of the same year. This validated the 39.50% horizontal area as long-term support. Previously, BTCD had not reached it since April 2018.
The ensuing bounce led to a bullish engulfing candlestick and an eventual high of 49.16%. However, this led to the creation of a long upper wick (red icon) and a decrease that is still ongoing.
While there are some trend reversal signs in place, such as the increasing MACD and RSI, the former is negative while the latter is still below 50.

BTCD breaks down
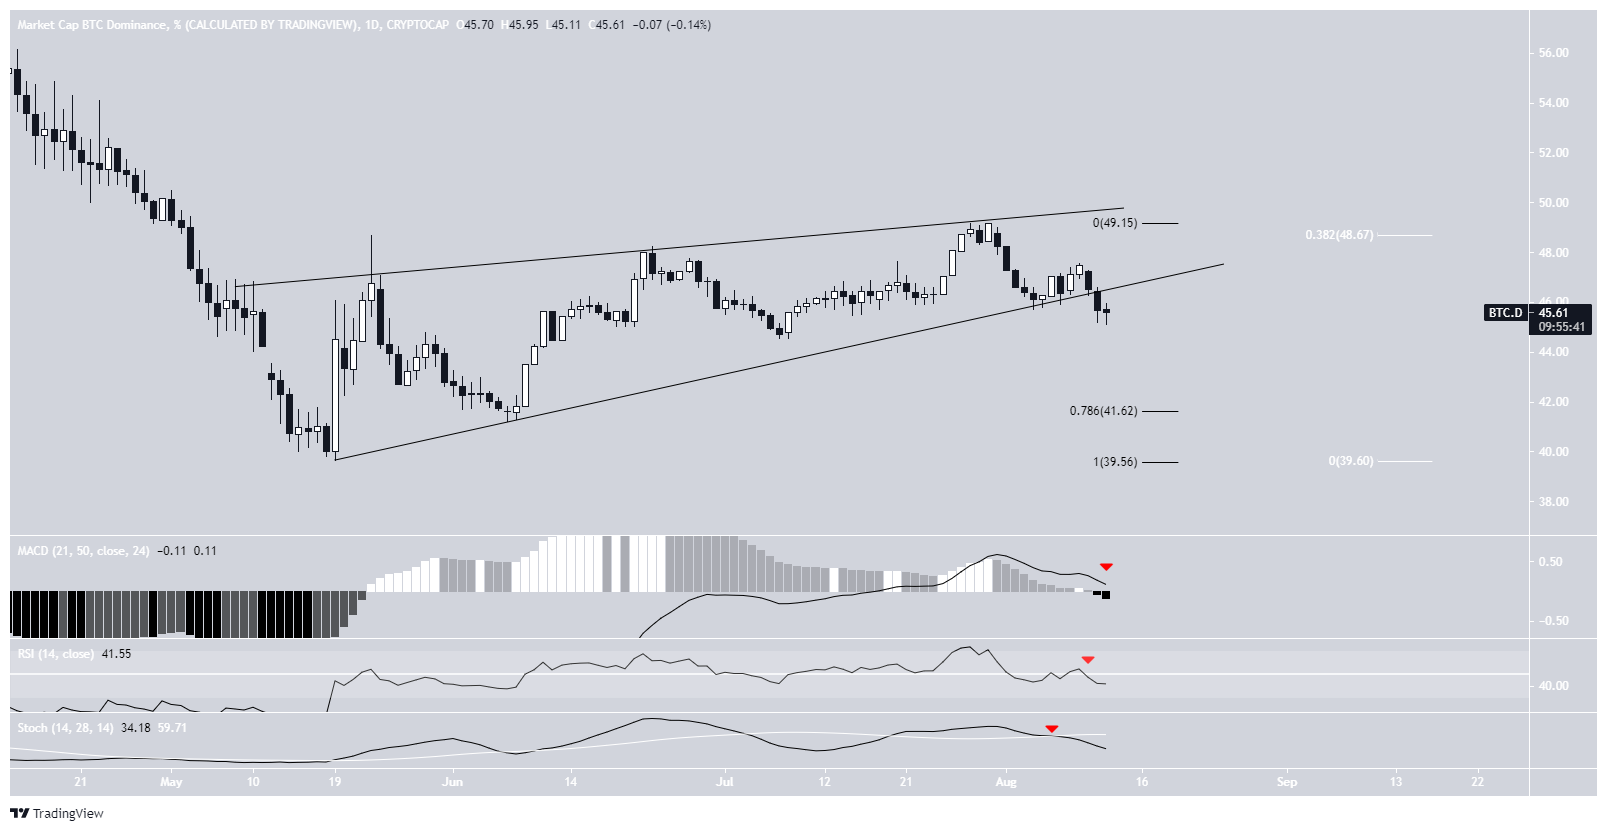
The daily chart is similarly bearish. Since the aforementioned bounce, BTCD had been increasing alongside an ascending wedge. However, it broke down from it on Aug. 10 and has been moving downwards since.
The rejection occurred right at the 0.382 Fib retracement (white) resistance level at 48.70%.
Technical indicators in the daily time-frame are bearish. The MACD has nearly crossed into negative territory, the RSI has moved above 50 and the Stochastic oscillator has made a bearish cross.
While there is minor support at 41.60%, it would make more sense if BTCD revisited the 39.50% long-term support area.

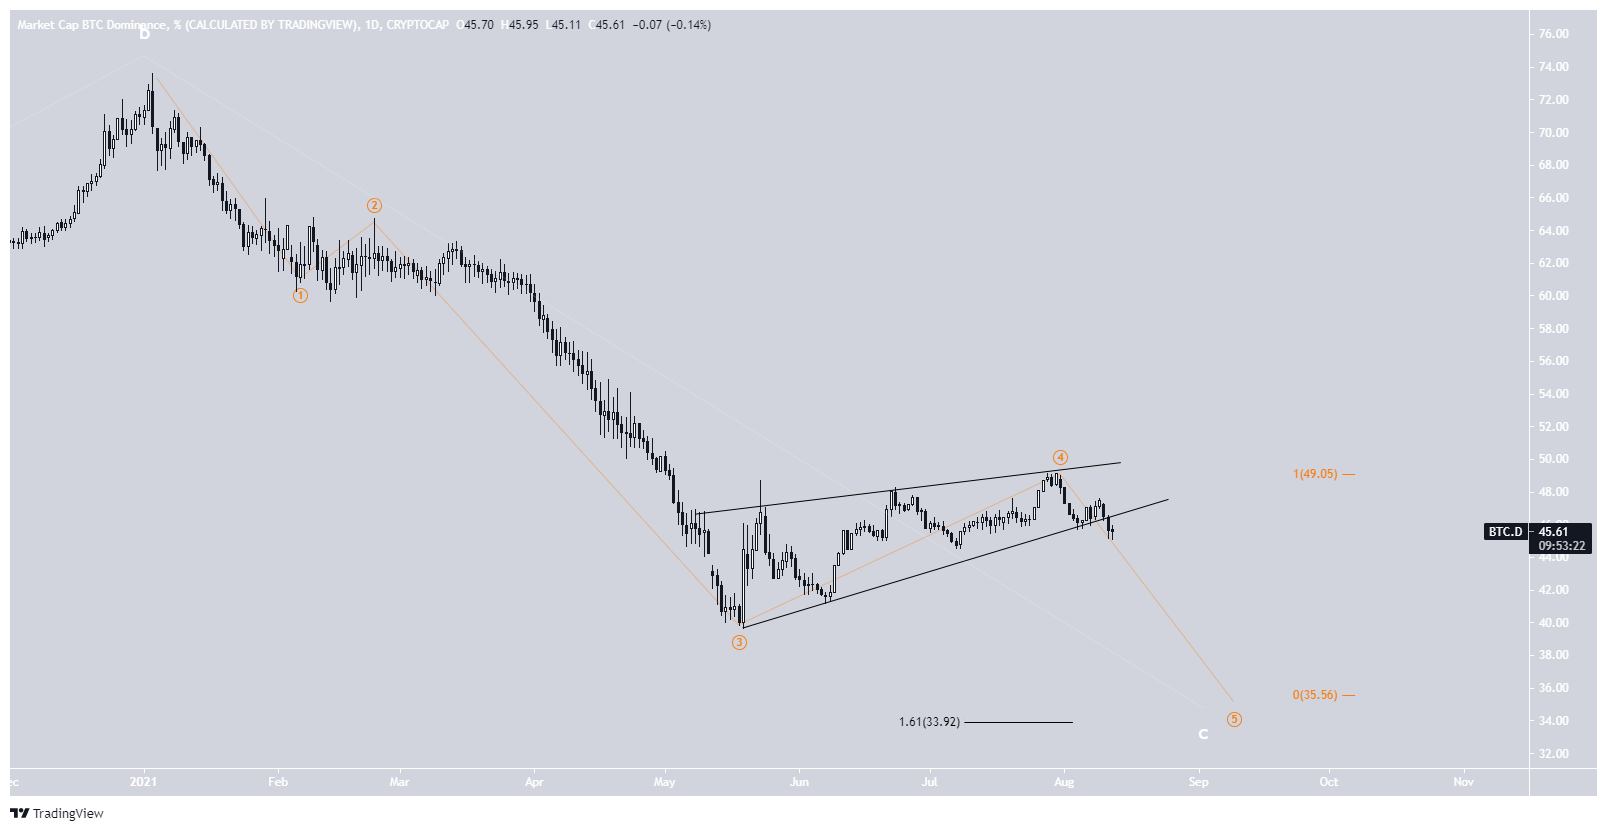
Wave count
Cryptocurrency trader @Altstreetbet outlined a BTCD chart, stating that it is likely to decrease towards new lows since it has completed wave four.
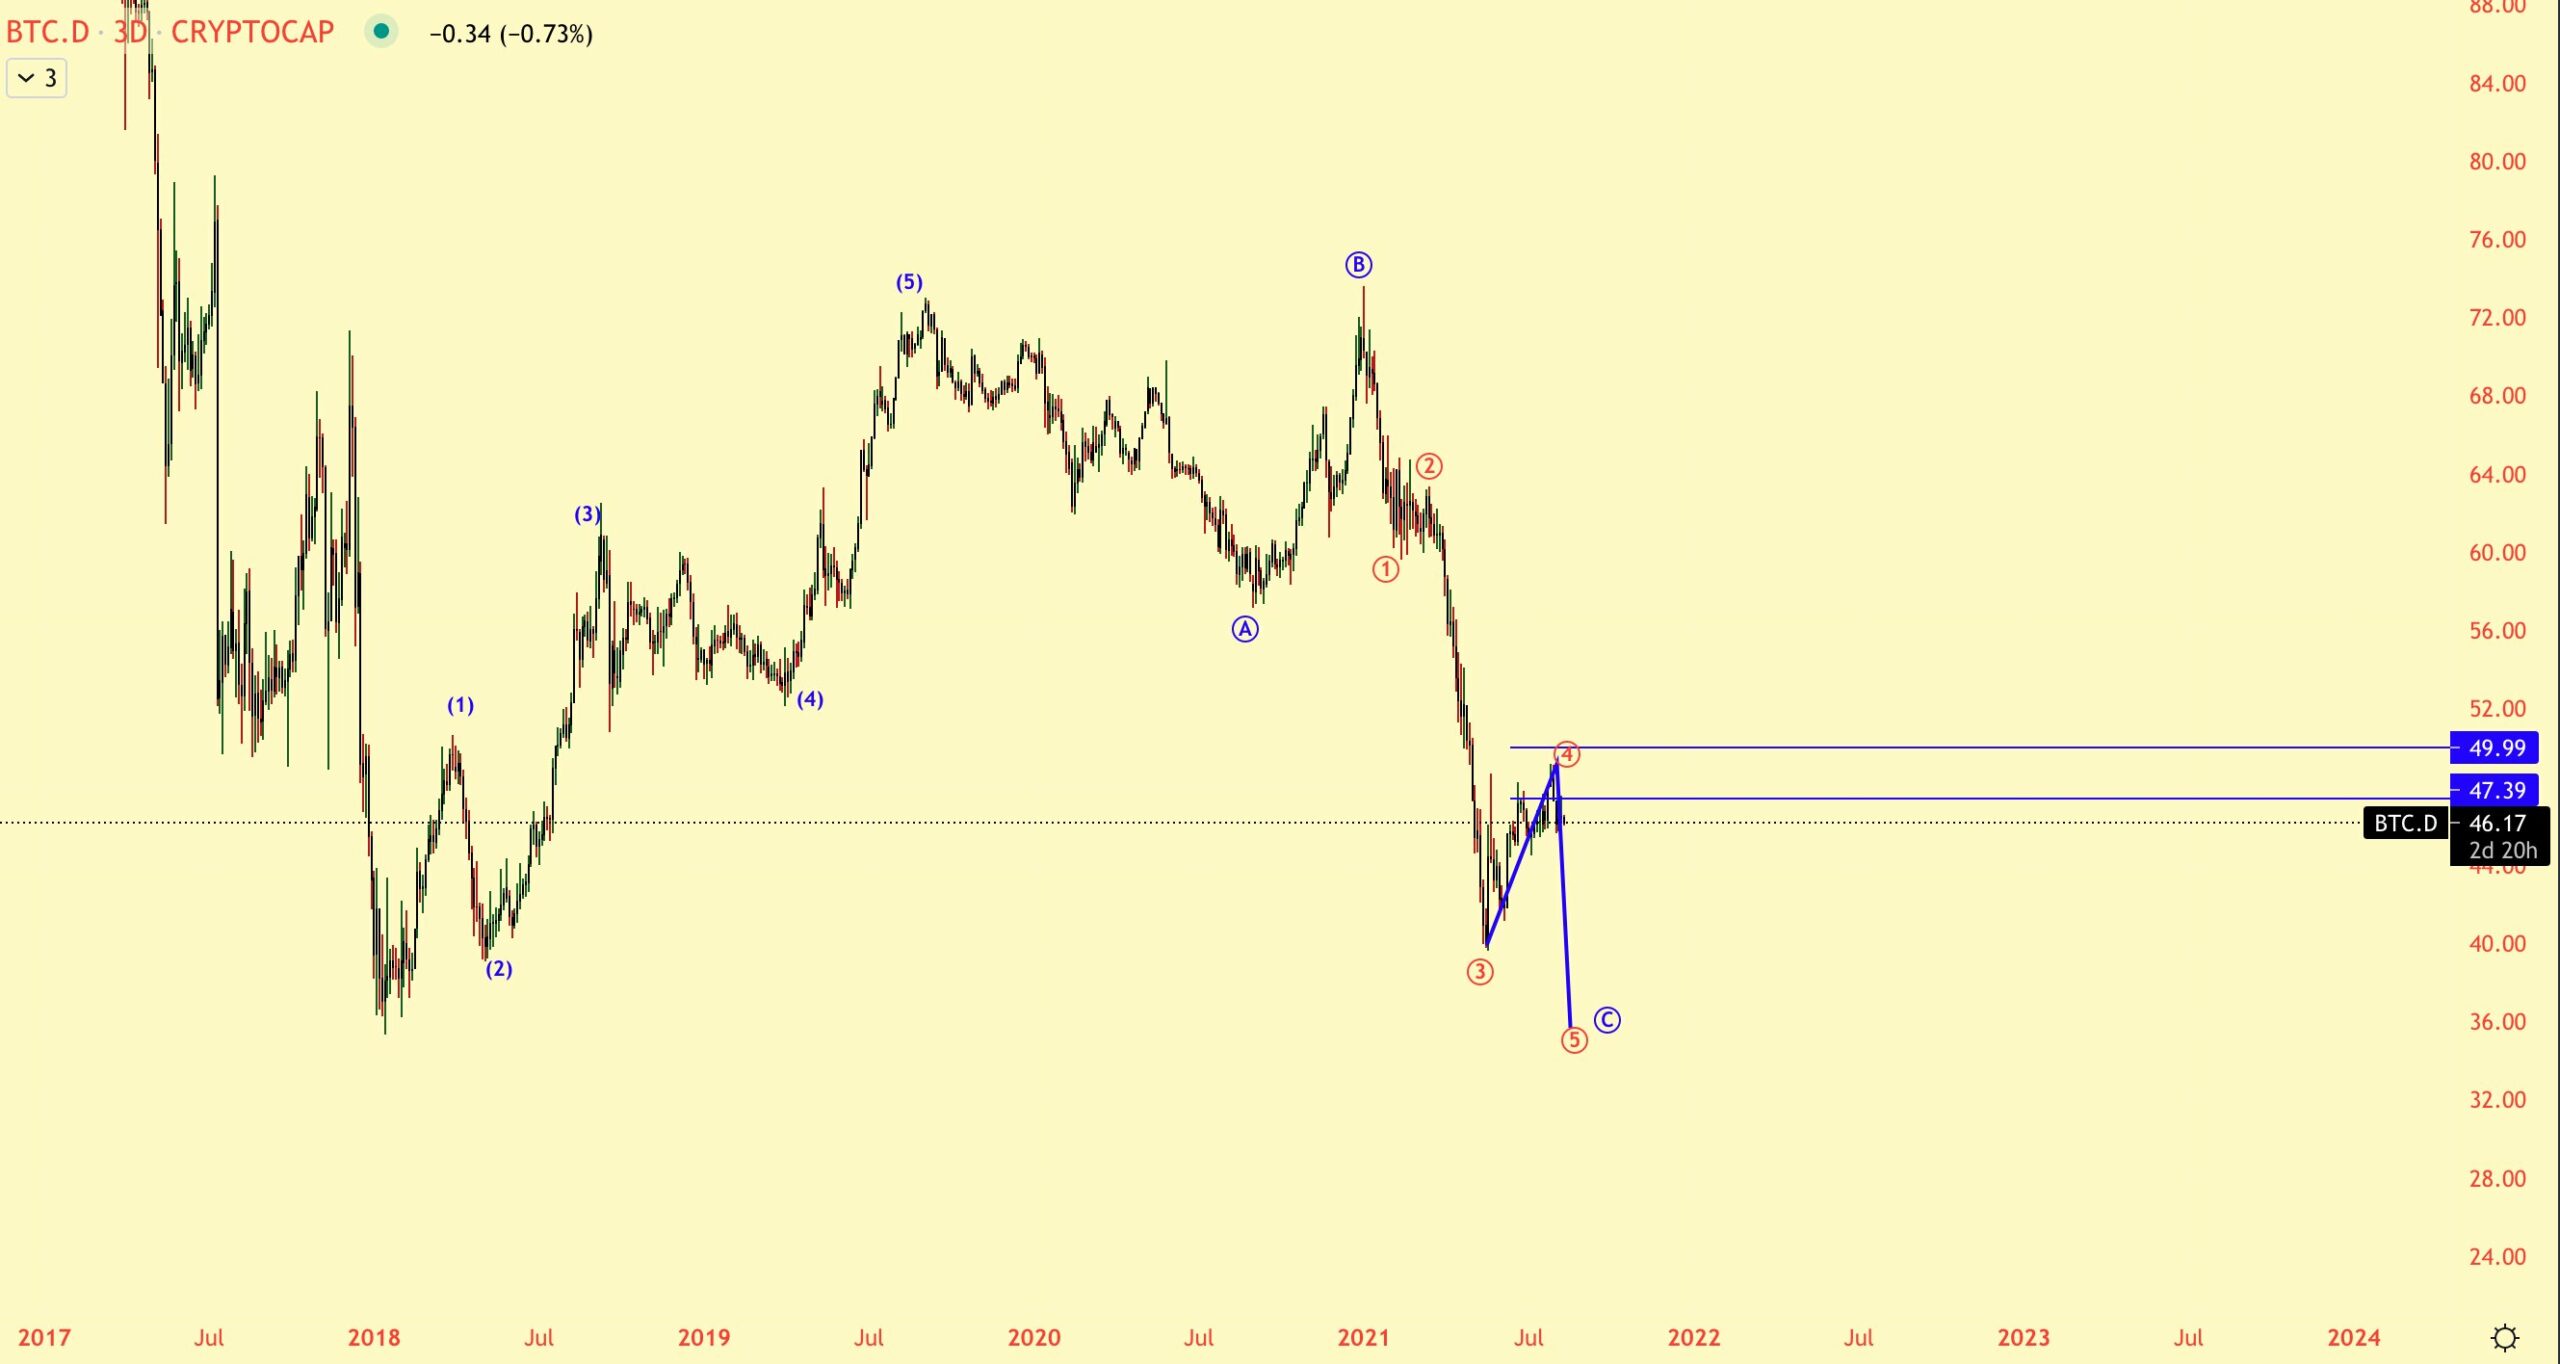

The most likely wave count is in alignment with what is given in the tweet.
If BTCD has begun wave five, the most likely target for the bottom of the movement is between 33.9 – 35.5%.
It is found by using the length of wave one (orange) and an external retracement on wave four (black).
For BeInCrypto’s latest bitcoin (BTC) analysis, click here.
Disclaimer
All the information contained on our website is published in good faith and for general information purposes only. Any action the reader takes upon the information found on our website is strictly at their own risk.
Source: https://beincrypto.com/alts-rejoice-as-btcd-breaks-down/